


1. Introduction
Speech production relies on a tight interplay between perception and production within individual speakers. To produce speech that meets communicative goals, speakers continuously monitor their own output against internal auditory expectations, using sensorimotor feedback mechanisms to calibrate and refine articulatory movements (e.g., Arjmandi & Behroozmand, 2024; Houde & Jordan, 2002; Tourville et al., 2008). The perceptual and productive systems underlying this process are, thus, not independent, but rely on shared or tightly coupled representations (e.g., Guenther, 1995; Whalen, 2020). This coupling, commonly referred to as the perception-production link (PP-link) (e.g., Flege, 1995; Newman, 2003), has long been recognized in speech science and forms a foundation for theories of speech motor control.
1.1 PP-link at the segmental level
Numerous studies investigating individual differences support the existence of a PP-link at the segmental level. These studies demonstrate that speakers who perceive phonemic contrasts more accurately also articulate those contrasts more distinctly. For example, English speakers who can discriminate between vowel contrasts (e.g., /ɑ/ – /ʌ/, /u/ – /ʊ/) or consonantal contrasts (e.g., /s/ – /ʃ/) more finely produce these categories with greater acoustic separation and reduced overlap, whereas poorer perceivers show smaller contrasts (Perkell, Guenther, et al., 2004; Perkell, Matthies, et al., 2004). Importantly, speakers with greater auditory-perceptual acuity can preserve such contrasts even under altered auditory feedback, indicating robust perception-linked control of articulation (e.g., Brunner et al., 2011; S. S. Ghosh et al., 2010). In such experiments, speakers receive real-time perturbations of their own speech signal via headphones, while producing differently sized speech units (see Elman, 1981, for one of the first studies on compensatory responses to real-time pitch perturbation). Moreover, PP-links have also been demonstrated at the subphonemic level: reaction times in cue-distractor tasks are reduced when the perceived distractor shares subphonemic features (e.g., vowel quality) with the target vowel to be produced (e.g., Ghaffarvand Mokari et al., 2020).
These behavioral findings can be explained by theoretical frameworks that posit tightly integrated sensory-motor mechanisms in speech planning and production. The Directions Into Velocities of Articulators (DIVA) model, for example, describes speech sounds as learned auditory-motor units, in which auditory targets in the phonetic space are closely linked to articulatory programs via shared neural mappings (see Bohland et al., 2010; Guenther, 1995; Guenther et al., 2013). Within this framework, speech sounds are acquired and planned in relation to sensory targets, and production accuracy is achieved through a combination of feedforward motor commands and auditory feedback-based error correction during development (Guenther, 2016; Meier & Guenther, 2023). Over time, repeated feedback-based corrections are incorporated into feedforward commands, resulting in more precise and less variable segmental production, as well as reduced reliance on real-time feedback (e.g., Smith et al., 2020; Villacorta et al., 2007). As a consequence, individuals with finer auditory-perceptual acuity are expected to form more precise auditory targets, supporting more accurate error detection and more stable articulatory patterns. This architecture provides a principled explanation for observed PP-links at the segmental level, whereby auditory-perceptual acuity predicts production distinctiveness and precision (Perkell, Guenther, et al., 2004).
1.2 PP-link at the suprasegmental (prosodic) level
The evidence for a PP-link at the segmental level raises the question of whether a similar relationship exists within prosody. Prosody refers to the suprasegmental aspects of speech, realized through acoustic features such as pitch (the perceptual correlate of fundamental frequency, f0), duration, rhythm, and loudness. These features organize speech into hierarchical units and facilitate comprehension (e.g., Frazier et al., 2006; Gollrad et al., 2010). When one or more of these features are functionally coordinated to signal prosodic structure (e.g., stress, prominence, or prosodic boundaries), they are referred to as prosodic cues. A single cue may, therefore, be realized through multiple features, and individual features may contribute to different cues, depending on the context.
Empirical studies examining a potential PP-link at the prosodic level have adapted the perturbation paradigms used for segmental research, by observing how speakers handle perturbations of suprasegmental features. In the spectral domain, Patel et al. (2011) found that speakers compensated for attenuated stress cues by increasing f0 and intensity, though word duration remained unchanged. This suggests that duration was not recruited as a compensatory cue under f0 perturbation. In the temporal domain, compensatory responses to perturbed vowel durations are found to be hierarchically structured, depending on syllable position and stress. Oschkinat and Hoole (2022) perturbed the same syllable type in either an unstressed word-initial or a stressed word-medial position within a trisyllabic German word. Perturbation of the unstressed syllable caused a global slowing of all following segments, whereas perturbation of the stressed syllable elicited only local adjustment within the perturbed syllable. This discrepancy indicates that speakers do not merely correct individual segment durations in isolation; rather, their compensatory responses maintain prosodic timing relations at the word level by preserving the durational structure between stressed and unstressed syllables, as opposed to targeting sounds as independent units. Together with evidence for cue trading and adaptive re-weighting in prosodic boundary marking (e.g., Cole & Shattuck-Hufnagel, 2016; Kentner et al., 2023; Patel & Schell, 2008), these findings suggest that prosodic cue control involves coordinated adjustments across multiple dimensions of the speech signal.
A number of studies have also established a correlation between individual auditory-perceptual acuity and the magnitude of these compensatory and adaptive responses. In the spectral domain, finer-grained pitch discrimination has been associated with stronger adaptation to sustained pitch perturbations (e.g., Martin et al., 2018). Similarly, for prosodic timing, Oschkinat et al. (2022) found that speakers’ responses to manipulated speech timing are jointly shaped by auditory-perceptual acuity and rhythmic abilities. However, the relative contributions of these factors vary according to the prosodic structure and whether responses signify online compensation or longer-term adaptation. These findings indicate that individuals differ systematically in how auditory feedback is integrated into prosodic motor control, paralleling individual-difference effects previously observed for segmental articulation.
The extension of PP-links from segments to prosody necessitates the introduction of additional distinctions, given the fundamental differences in the representation and control of suprasegmental features. The Gradient Order DIVA (GODIVA) model is an extension of the DIVA model that incorporates mechanisms for the planning and sequencing of multisyllabic utterances. These mechanisms include metrical structure, stress patterns, and the temporal coordination of speech units (see Bohland et al., 2010; Tourville & Guenther, 2011). Recent advancements in the field have enabled the representation of spectral prosodic features, such as pitch, as auditory targets. This development constitutes a significant extension of the DIVA (LaDIVA) framework, as it now encompasses the modeling of pitch control and adaptation within an auditory feedback paradigm (Weerathunge et al., 2022). In contrast, temporal cues, such as pauses and the lengthening of segments, are not represented as explicit auditory targets. Instead, they are primarily implemented via GODIVA’s metrical and initiation maps, which govern the timing and release of speech units and reflect structural constraints of the prosodic system, rather than fine-grained auditory templates. Suprasegmental cues, thus, do not take the form of discrete symbolic representations. Rather, they are emergent control states that constrain the coordination of multiple acoustic features over time.
This representational asymmetry carries direct implications for the nature of PP-links. For spectral cues, such as pitch, higher auditory-perceptual acuity may facilitate more precise auditory goals and more flexible online correction. For temporal cues, however, the underlying mechanisms linking acuity and production are less well specified: these cues are primarily implemented via feedforward sequencing mechanisms rather than explicit auditory targets, and their production is further constrained by temporal irreversibility, placing greater emphasis on motor planning and stability (e.g., Miller & Guenther, 2021; Oschkinat et al., 2022; Oschkinat & Hoole, 2022). It is, therefore, hypothesized that prosodic PP-links will reflect an interaction between auditory-perceptual acuity, motor stability, and the structural properties of the prosodic system (e.g., prosodic hierarchy and cue-specific temporal constraints), and, consequently, that they are cue-specific in nature.
1.3 Prosody and syntactic disambiguation
Prosody plays a crucial role in speech comprehension by resolving structural ambiguities in sentences (e.g., Frazier et al., 2006). For example, in the structurally ambiguous sentence She will visit Berlin or Rome and Vienna, a prosodic break after Berlin leads listeners to interpret it as ‘She will visit (Berlin) or (Rome and Vienna)’, whereas a break after Rome yields ‘She will visit (Berlin or Rome) and (Vienna)’. Prosodic boundaries, thus, provide listeners with critical parsing information through variations in spectral and temporal boundary cues.
Coordinate name sequences have been used to systematically study how speakers use prosody to distinguish between different structural groupings (e.g., Huttenlauch et al., 2021; Kentner & Féry, 2013; Petrone et al., 2017; Schubö et al., 2023). For instance, in response to a question like “Who is coming to the event?”, speakers might produce:
- (1)
- German: Bracket condition, with an internal prosodic boundary after Name2
- (Moni und Lilli) || und Manu.
- ‘Moni and Lilli, and Manu.’
- (Name1 und Name2) || und Name3.
- ‘Name1 and Name2, and Name3.’
- (2)
- German: No-bracket condition, without an internal prosodic boundary
- Moni und Lilli und Manu.
- ‘Moni and Lilli and Manu.’
- Name1 und Name2 und Name3.
- ‘Name1 and Name2 and Name3.’
In the bracket stimulus condition (1), a prosodic boundary following the second name, denoted here by ||, establishes a subgroup, suggesting that Moni and Lilli are arriving as a pair, separate from Manu. In the no-bracket stimulus condition (2), without this boundary, the implication is that all three are arriving collectively. The distinction in meaning relies entirely on the internal prosodic boundary, as the underlying words remain the same in both cases.
To mark prosodic boundaries in coordinated name sequences, German speakers reliably use a combination of prosodic boundary cues, most prominently pitch range, silent pause, and final lengthening (e.g., Huttenlauch et al., 2021; Kentner & Féry, 2013; Petrone et al., 2017; Schubö et al., 2023). These cues differ systematically in their perceptual salience and functional role. Pauses typically elicit sharp, categorical boundary judgments and are particularly informative at strong boundaries, whereas pitch and final lengthening seem to have more gradient effects and interact with boundary strength and contextual expectations (e.g., Petrone et al., 2017; Pijper & Sanderman, 1994).
Cross-linguistic evidence further indicates that these cues are not functionally equivalent. Pitch cues demonstrate the highest degree of cross-linguistic variability, with their weighting and interpretation contingent on a language’s prosodic typology (e.g., stress-accented vs. tonal systems) and communicative demands (e.g., Holzgrefe-Lang et al., 2016; Ortega-Llebaria & Nagao, 2025; Yang et al., 2014). In the German language, pitch is a primary but flexible boundary cue, contributing to both syntactic disambiguation and the expression of pragmatic or affective meaning. It is often integrated with temporal cues rather than used in isolation (e.g., Holzgrefe-Lang et al., 2016, 2018). Pauses, by contrast, represent a highly salient and largely language-general segmentation cue, though their use is optional at weaker boundaries (e.g., Männel & Friederici, 2016; Pijper & Sanderman, 1994), while final lengthening constitutes a near universal right-edge cue, robustly attested across languages and prosodic systems (e.g., Byrd et al., 2006; Wightman et al., 1992).
1.4 Individual differences in prosodic perception and production
Huttenlauch et al. (2021) demonstrated that while speakers show high intra-individual consistency in boundary marking, they differ from each other in their preferred prosodic boundary cue combinations. Despite the presence of these inter-individual differences, listeners demonstrated an ability to accurately recognize the intended prosodic groupings in over 95% of utterances, suggesting the presence of robust compensation for speaker variability.
In a complementary perception study, Hansen et al. (2023) found significant inter-individual variability in prosodic boundary perception. They presented the coordinated three-name stimuli incrementally, syllable by syllable (e.g., Mi, Mimmi, Mimmi und, Mimmi und Ne, and so forth) and listeners had to predict after each snippet if it would belong to a structure with or without a prosodic boundary after the second name. Some listeners could exploit subtle prosodic boundary cues very early – during the first name – to accurately predict upcoming syntactic grouping. Others required more prosodic information, only making accurate predictions after hearing the second name. This variation in early prosodic boundary cue sensitivity indicates that prosodic parsing depends not only on acoustic input, but also on listener-specific auditory-perceptual abilities.
These parallel findings of systematic inter-individual variation in both production and perception are consistent with broader evidence that speakers encode prosodic meaning through structured individual differences in prosodic boundary cue distributions. Xie et al. (2021) elicited question-statement productions from English speakers and found substantial structured variability in how different talkers used f0 and duration to mark the contrast: some speakers relied primarily on pitch rises, others used both pitch and lengthening, and, crucially, speakers also differed in how consistently they produced these cues. The authors employed ideal observer models that incorporated talker-specific distributional statistics of prosodic cues. These models, which reflected both typical realizations and their spread, exhibited substantially superior performance in comparison to models that only normalized for baseline pitch. In a subsequent perceptual study, listeners rapidly adapted to talker-specific “prosodic dialects,” shifting their categorization of identical utterance-final pitch contours as questions or statements after briefly learning a new speaker’s prosodic patterns. Together, these findings demonstrate that prosodic variability is structured and functionally meaningful: speakers produce systematic distributional patterns that listeners track and exploit for more accurate interpretation.
Building on this evidence of systematic individual variation in prosodic processing, our study investigates whether individual differences in perception predict individual differences in production. This leads to our central research question: Does a PP-link for prosodic boundary cues exist at the level of individual differences across participants? In other words, are participants who demonstrate heightened perceptual sensitivity to prosodic boundary cues also those who produce more distinctive and less variable prosodic boundaries?
Prior studies have demonstrated prosodic PP-links using perturbation paradigms (e.g., Oschkinat & Hoole, 2022; Patel et al., 2011), which revealed compensatory mechanisms in prosodic control. However, because these paradigms rely on experimentally imposed feedback manipulations, they may induce heightened speaker awareness and reactive strategies that differ from those engaged during natural, communicative speech, potentially limiting their generalizability (e.g., Dahl et al., 2024; Houde & Jordan, 1998; Tomassi et al., 2022). For instance, the magnitude of adaptation to f0 perturbations in linguistically neutral sustained vowels does not correlate with that during sentence production, suggesting distinct mechanisms at play in perturbation paradigms (Dahl et al., 2024), as compared to natural speech. Additionally, perturbation paradigms often focus on immediate compensation for specific cues (e.g., f0 shifts or temporal alterations), underexploring baseline variability across multiple prosodic features or the influence of moderators like attention. The current study, therefore, examines the PP-link in a more ecologically valid context: speakers’ natural production of prosodic boundary cues (pitch range, pause duration, and final lengthening) during syntactic disambiguation tasks, with and without cognitive load. By incorporating all three primary prosodic boundary cues co-occurring in the same stimuli, the present design preserves their natural integration. At the same time, by analyzing each cue separately, we test how individual differences in auditory-perceptual acuity relate to prosodic boundary cue production distinctiveness and variability under varying cognitive load mimicking communicative demands (e.g., multitasking).
1.5 Testing the PP-link under cognitive load
While existing evidence suggests that prosodic PP-links are shaped by multiple interacting factors, there is currently no unified account specifying how individual differences in auditory-perceptual acuity map onto prosodic cue use. For segmental targets, the DIVA framework provides a mechanistic account of how auditory-perceptual acuity shapes production precision: finer auditory targets support more accurate error detection and more distinct articulatory patterns, a prediction that is consistently supported by empirical evidence involving individual differences (e.g., Perkell, 2012). The present study, therefore, adopts the segmental PP-link literature as a principled baseline. This allows us to formulate testable predictions about whether auditory-perceptual acuity similarly constrains the production of suprasegmental cues.
To test whether a PP-link exists at the prosodic level, we examined individual differences in auditory-perceptual acuity and in the production of prosodic boundaries in coordinated three-name sequences. In production, participants used prosody to disambiguate syntactic structure by marking or omitting an internal prosodic boundary after the second name (bracket vs. no-bracket stimulus condition). In perception, auditory-perceptual acuity was assessed independently, using Just-Noticeable-Difference (JND) thresholds for detecting graded changes in the same acoustic dimensions that function as prosodic boundary cues in production, namely, pitch range, pause duration, and final lengthening.
Perception and production were linked at the level of individual differences and analyzed using Bayesian distributional models that estimate both mean prosodic boundary cue realization (reflecting production distinctiveness) and trial-to-trial variability (captured by the sigma parameter, reflecting production variability). This modeling approach allows us to test not only whether participants with better perception produce stronger prosodic contrasts, but also whether they do so more or less variably across repetitions.
To examine individual differences in prosodic boundary production under varying processing demands, we manipulated cognitive load during speech production by introducing a dual-task condition, creating distinct low and high cognitive load conditions. According to Lindblom’s Hyper-Hypo theory (Lindblom, 1990), speakers continuously trade off communicative clarity against articulatory effort, depending on contextual demands. When cognitive resources are limited, speakers tend to economize speech production, resulting in reduced articulatory precision or attenuated prosodic marking, unless communicative demands require otherwise (e.g., Lindblom, 1990; Winkworth & Davis, 1997). In the present study, the dual-task manipulation served a methodological purpose: it introduced controlled processing demands by drawing attentional resources away from speech planning and execution under high cognitive load, without inducing speech errors or breakdowns. Under these conditions, high cognitive load was expected to increase trial-to-trial variability within participants (captured by the σ parameter). High cognitive load may also amplify differences between participants in their mean prosodic boundary cue realization (captured by the μ parameter), thereby creating a critical testing ground for examining how auditory-perceptual acuity relates to production under varying speech processing demands. While differences in variability under high cognitive load could also reflect general cognitive advantages (e.g., superior multitasking ability), the present study focuses specifically on how auditory-perceptual acuity modulates these effects.
Cognitive load was expected to interact with auditory-perceptual acuity in a cue-specific manner. For spectral prosodic cues, such as pitch, which can be represented as auditory targets within the DIVA framework, higher auditory-perceptual acuity was predicted to support more precise auditory goal regions and more effective maintenance of informative prosodic marking under load (e.g., Perkell, 2012; Tourville & Guenther, 2011). For temporal cues, such as pause and final lengthening, which are implemented via sequencing mechanisms rather than explicit auditory targets, the underlying mechanisms linking acuity and production are less well specified. Here, we provisionally extend the same prediction derived from segmental research and treat the presence or absence of PP-links for temporal cues as an empirical question, asking whether production effects associated with auditory-perceptual acuity for spectral prosodic boundary cues also appear for temporal prosodic boundary cues.
Finally, greater trial-to-trial variability in prosodic production would not necessarily reflect imprecision or noise. In prosody, production variability can also arise from flexible weighting of cues, in how they are combined, and from the fact that prosodic boundary cues serve multiple functions in speech (e.g., Cole & Shattuck-Hufnagel, 2016; Kentner et al., 2023; Petrone et al., 2017). From this perspective, individual differences in prosodic production variability may index differences in how participants dynamically deploy multiple prosodic boundary cues under varying contextual and processing demands, rather than differences in motor stability alone.
1.6 Aims and hypotheses
Building on prior evidence for individual differences in prosodic perception and production (Hansen et al., 2023; Huttenlauch et al., 2021), the present study investigates whether auditory-perceptual acuity for prosodic boundary cues predicts how those same cues are produced during syntactic disambiguation, and whether this relationship is modulated by cognitive load.
We address two primary hypotheses, each targeting a distinct aspect of prosodic production:
Hypothesis 1 (H1): Effect of auditory-perceptual acuity on production distinctiveness. Our first hypothesis concerns production distinctiveness. Operationally, distinctiveness refers to the mean difference in prosodic boundary cue realization between stimulus conditions (bracket vs. no-bracket), estimated by the model’s mean (μ) parameter. For pitch range and final lengthening, derived from segmental perception-production evidence, we hypothesize that higher auditory-perceptual acuity is associated with greater production distinctiveness, that is, larger mean differences between bracket and no-bracket productions, indicating stronger acoustic separation to convey the different groupings. Because pauses are almost exclusively realized in bracket productions, pause analyses focus on bracket stimuli only (see 2.4.4). For pauses, distinctiveness is, therefore, defined as pause duration within bracket stimuli rather than as a difference across stimulus conditions. We hypothesize that higher auditory-perceptual acuity is associated with longer pauses, particularly under high cognitive load. For all three prosodic boundary cues, we expect the relationship between auditory-perceptual acuity and production distinctiveness to be more pronounced under high cognitive load, where increased processing demands may amplify inter-individual differences.
Hypothesis 2 (H2): Effect of auditory-perceptual acuity on production variability. Our second hypothesis concerns production variability. Operationally, production variability refers to the trial-to-trial spread of prosodic boundary cue realizations within a participant, captured by the model’s variability (σ) parameter. For all three prosodic boundary cues, we hypothesize that higher auditory-perceptual acuity is associated with lower production variability, that is, smaller σ values in prosodic boundary cue realizations across repeated productions. This variability effect is expected across both cognitive load conditions, but should be more pronounced under high cognitive load, where participants with lower auditory-perceptual acuity are predicted to show greater increases in production variability.
For pitch range and final lengthening, this hypothesis concerns whether auditory-perceptual acuity modulates the difference in production variability between bracket and no-bracket productions. For pause duration, it concerns production variability within bracket productions only.
2. Methods and materials
This study was preregistered (https://osf.io/dvuw6).
2.1 Participants
Sixty native German speakers participated in the study, with a mean age of 24.78 years (standard deviation, SD = 6.07, range: 18–49). The sample comprised 48 females and 12 males. No formal a priori power analysis was conducted. The preregistered target sample size was determined based on the sample sizes used in previous work in prosodic perception-production research and was deemed sufficient to detect individual-differences effects (e.g., Hansen et al., 2023; Huttenlauch et al., 2021; Martin et al., 2018; Oschkinat & Hoole, 2022). Participants were native speakers of German without a history of speech or language disorders, hearing impairments, or neurological or psychological conditions. They received either 40€ or 5 course credits for completing two experimental sessions (approx. 2 hours each), scheduled on the same or separate days, based on availability. The two experiments reported here were both conducted during the first session.
No participants were excluded based on the preregistered criterion for adaptive staircase performance (Oschkinat et al., 2022). This criterion required JND thresholds to decrease below 70% of the initial cue difference, indicating appropriate task engagement (for JND task description and thresholds, see 2.3.2). However, following data inspection, some participants exhibited extreme JND values, suggesting atypical or invalid response patterns (e.g., one participant showed a JND for pitch that was more than 7 standard deviations above the group mean). To address this issue, we excluded participants whose JND scores fell below the first quartile (Q1) minus two times the interquartile range (IQR), or above the third quartile (Q3) plus two times the IQR. This led to the exclusion of three participants from the pitch model, leaving N = 57, and two from the pause model, leaving N = 58. No exclusions were made for the final lengthening model.
2.2 General procedure
Participants were tested individually in a sound-attenuated booth. Visual stimuli were presented on a 1080 × 1920 pixel monitor, with keyboard input used to record responses for the perception task. For the production task, verbal responses were recorded at a 48 kHz sampling rate, using a Beyerdynamic DT-297 headset (80 Ohm headphones, 300 Ohm condenser mic, 5 cm distance from chin), connected to a Focusrite Scarlett 18i8 audio interface. All experimental procedures were controlled by custom Python 3.8 scripts (PyCharm, Windows 10).
2.3 Perception: JND task
2.3.1 Stimuli
To assess auditory-perceptual acuity for acoustic dimensions that serve as prosodic boundary cues in production, we constructed three independent acoustic continua targeting pitch range, pause duration, and final lengthening. For brevity, we refer to these acoustic dimensions as prosodic boundary cues throughout, recognizing that their cue status depends on functional deployment in context. Crucially, while these cues are typically associated with boundary marking, the JND task itself was not designed to test boundary perception. Instead, it quantified listeners’ sensitivity to graded changes in the underlying acoustic dimensions themselves.
All continua were derived from original speech recordings previously used in a perception study by de Beer et al. (2022). In that study, a phonetically trained female speaker produced coordinated three-name sequences with systematically varied prosodic realizations. From this corpus, we selected tokens that exhibited the strongest acoustic realization of each prosodic boundary cue. Specifically, we identified the (separate) instances in which (a) the pitch range between the stressed and unstressed syllables of Name2 was maximal, (b) a clear and long silent interval followed Name2, and (c) the final segment of Name2 showed maximal lengthening. Since the maximal realization of each prosodic boundary cue occurred in different three-name sequences within this corpus, the base stimulus for each continuum was drawn from a different three-name sequence.
These segments with maximal prosodic boundary cue realization were then extracted and served as the base stimuli for the construction of three JND continua, using custom Praat scripts (Boersma & Weenink, 1992–2020). Each continuum ranged from the clearly (maximally) cued stimulus to a minimally cued reference stimulus, thereby spanning a graded decrease in the magnitude of the manipulated acoustic feature (and, thus, in the typical acoustic realization associated with boundary marking). Each continuum spanned from the original recording including the maximal realization of the targeted prosodic boundary cue to a version of the same recording manipulated to have the minimal realization of the targeted prosodic boundary cue. All intermediate steps consisted of systematically attenuated versions covering the range between these endpoints.
Pitch range continuum: The pitch continuum was based on the Name2 token Nelli (from the sequence Mimmi und Nelli || und Lola.), produced with a pitch range of 13 semitones. This rising contour was gradually flattened from 13 to 0 semitones in steps of 0.005 semitones, yielding a fully level contour as the reference stimulus.
Pause duration continuum: For the pause continuum, we used the phrase Name2 und Name3 (Lilli [PAUSE] und Lisa, from the sequence Moni und Lilli || und Lisa.), which contained a silent interval of 550 ms following Lilli. The pause duration was reduced in 1 ms increments from 550 ms to 0 ms, with the endpoint representing a stimulus without any pause.
Final lengthening continuum: The final lengthening continuum was constructed from the Name2 token Mimmi (from the sequence Leni und Mimmi || und Manu.), in which the final vowel had a duration of 225 ms (approximately half of the total word duration). This segment was progressively shortened in steps of 0.3 ms until a duration of 61 ms was reached, resulting in approximately equal syllable durations and, thus, minimal perceptual lengthening.
2.3.2 Procedure
Auditory-perceptual acuity thresholds for each prosodic boundary cue continuum were obtained, using an AXB discrimination task combined with an adaptive staircase procedure (adapted from Smith et al., 2020). Each participant completed three separate JND tasks, one for each prosodic boundary cue (pitch range, pause duration, final lengthening). The task order was randomized across participants. At the beginning of each task, participants completed a brief practice phase with visual accuracy feedback until they produced four consecutive correct responses. No feedback was provided during the experimental phase.
Trial structure: Each trial consisted of an AXB stimulus sequence (either AAB or ABB), with an inter-stimulus interval of 500 ms. Across trials, participants heard two types of tokens: a reference stimulus with minimal or absent cue expression (0 semitones pitch range, 0 ms pause duration, or 61 ms final lengthening) and a comparison stimulus drawn from the respective prosodic boundary cue continuum. The acoustic distance between reference and comparison, referred to here as the cue difference, determined task difficulty: larger cue differences yielded easier discrimination, while progressively smaller cue differences probed listeners’ discrimination limits.
The order of reference and comparison tokens was randomized across trials, resulting in sequences containing either two identical reference tokens and one comparison token, or vice versa. Participants indicated which stimulus was different by pressing the right arrow key for AAB sequences and the left arrow key for ABB sequences. Visual response prompts remained visible until a response was made, and depicted arrow icons alongside schematic stimulus patterns (with “A” boxes shown in green and “B” boxes in black).
Adaptive staircase: With the adaptive staircase procedure, we adjusted cue differences on a trial-by-trial basis to converge on each participant’s discrimination threshold, defined as the smallest reliably detectable acoustic difference. All staircases started with the maximum available cue difference, to ensure initial discriminability (13 semitones for pitch range, 550 ms for pause duration, and 164 ms for final lengthening). Following each response, cue differences were modified as a function of performance: correct responses reduced the cue difference, whereas incorrect responses increased it.
Step sizes, defined as the amount by which the cue difference between reference and comparison stimuli was increased or decreased from one trial to the next, decreased progressively over the course of the staircase. Large initial step sizes enabled rapid movement toward the participant’s approximate threshold region, while smaller later step sizes allowed fine-grained estimation. Step sizes ranged from 0.75 to 0.005 semitones for pitch range, from 30 to 1 ms for pause duration, and from 7.5 to 0.3 ms for final lengthening.
At the beginning of each staircase, a 1-down-1-up adjustment rule was used to promote rapid convergence toward the threshold region. After the first incorrect response, the procedure switched to a 2-down-1-up rule, such that two consecutive correct responses were required to decrease the cue difference, whereas a single incorrect response was sufficient to increase it. This asymmetric update rule converges on a performance level of approximately 71% correct responses (Levitt, 1971), a threshold determined by the balance of probabilities of upward and downward step adjustments in a 2-down-1-up staircase: at equilibrium, the probability of decreasing the cue difference (requiring two consecutive correct responses, with probability p2) equals the probability of increasing it (1 – p2), yielding . This value represents the cue difference, where discrimination is achieved with about 71% accuracy, providing a stable estimate of the perceptual threshold, while avoiding ceiling (near 100% performance) and floor (near chance) effects that could bias measurements. A reversal was defined as a change in the direction of cue difference adjustment (from increasing to decreasing or vice versa). Each task terminated after 120 trials or 18 reversals, whichever occurred first. Threshold estimation was based on the sequence of reversal points, as described below.
2.3.3 Data pre-processing
For each prosodic boundary cue, the JND threshold was computed as the mean of the six most stable consecutive reversal points, operationalized as the set of six adjacent reversals with the lowest standard deviation (Brunner et al., 2011; Oschkinat et al., 2022). These values represent the smallest acoustic differences participants could reliably discriminate, with lower raw thresholds indicating better auditory-perceptual acuity.
To facilitate interpretation and ensure consistency across analyses, raw JND thresholds were z-scored and sign-reversed, such that higher values correspond to better auditory-perceptual acuity. These transformed measures are referred to throughout as pitch acuity, pause acuity, and final lengthening acuity, reflecting participants’ standardized auditory-perceptual acuity for each prosodic boundary cue. Figure 1 illustrates the distributions of raw JND thresholds in their original measurement units for each prosodic boundary cue.
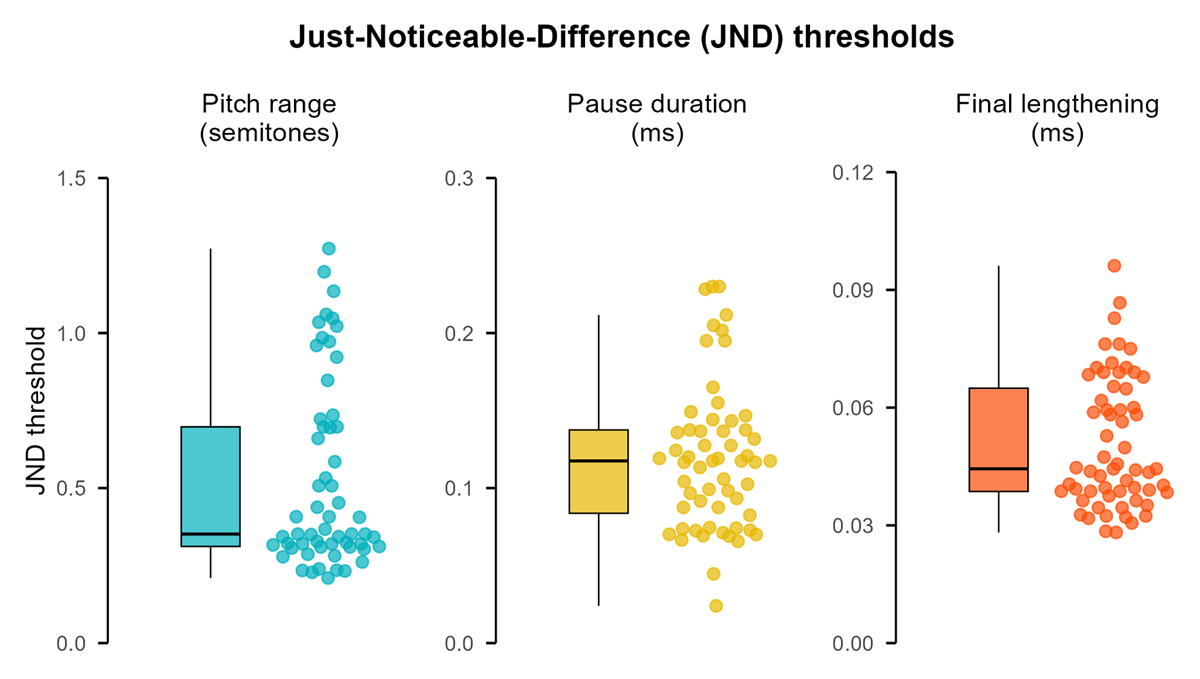
Figure 1: Distribution of individual JND thresholds for each prosodic boundary cue. Panels show raw JND thresholds in native units (ms for pause and final lengthening, semitones for pitch). Only data from analyzed participants are shown (n = 57 pitch, n = 58 pause, n = 60 final lengthening).
2.4 Production: Cognitive load task
2.4.1 Stimuli
The production task used 24 written name sequences arranged in coordinate structures that have been employed in prior production and perception research (de Beer et al., 2022; Hansen et al., 2023; Huttenlauch et al., 2021). Each sequence consisted of three disyllabic German names. The first two names consistently ended in the vowel /i/ (Moni, Lilli, Leni, Nelli, Mimmi, Manni), while the third name ended in either /u/ or /a/ (Manu, Nina, Lola).
Stimuli were balanced across two conditions. In the bracket stimulus condition (12 items), parentheses indicated a prosodic boundary after the second name (e.g., (Moni und Lilli) und Manu). In the no-bracket stimulus condition (12 items), the same sequences were presented without grouping markers (e.g., Moni und Lilli und Manu).
2.4.2 Procedure
Participants read aloud written name sequences under two cognitive load conditions: (i) a low cognitive load (single task) condition, involving only the reading task, and (ii) a high cognitive load (dual-task) condition, designed to increase cognitive load by adding two concurrent tasks.
Each trial began with the prompt Wer kommt? (‘Who’s coming?’) displayed for 1 second, followed by a 1-second fixation cross. The name sequence then appeared for 5.8 seconds (350 frames), during which participants read the sequence aloud.
In the high cognitive load condition, participants simultaneously performed (a) a tone-counting task and (b) a motion-tracking task while reading. Each trial featured a sequence of approximately 23 tones (0.2 s duration, 0.58 s inter-stimulus-intervals) spanning the entire trial (~20 s). Tones were played before the name sequence appeared on screen, were then suspended during the reading phase (from 0.2 seconds before to 0.2 seconds after presenting the name sequence on the screen, to avoid auditory interference), and resumed afterward. During the reading phase, 500 moving dots (50% coherent motion in one of four directions: up, down, left, or right) were superimposed on the name sequence for 4.2 seconds. Participants had to track the motion direction while reading aloud.
Each trial, therefore, consisted of three phases: an initial tone-counting phase, a dual-task reading and motion-tracking phase, and a final tone-counting phase. The tone-counting task involved detecting and counting high-pitched deviant tones (octave 5 “A” notes) embedded among standard mid-pitched tones (octave 5 “C” notes), with 3–10 deviants randomly distributed across the initial and final phases of each trial (at least three overall). After each trial, participants provided two responses using arrow keys. First, they reported the perceived motion direction (selecting from four directional options). Second, they reported the cumulative count of deviant tones heard across both tone-counting phases, selecting from four numeric options (the correct count and three distractors within ±3).
Both cognitive load conditions included a practice phase. In each cognitive load condition, participants read aloud four practice stimuli: two bracket and two no-bracket items (featuring name sequences not used in the test phase). The low load practice phase served only to familiarize participants with the reading task and recording setup. No trial-by-trial performance feedback was provided. The high load practice phase used the same reading task, but additionally included the secondary tasks, that is, tone-counting and motion-tracking. For these secondary tasks, participants received automated on-screen accuracy feedback (“correct answer”/“incorrect answer”).
The main experiment comprised 24 trials under each cognitive load condition (12 bracket, 12 no-bracket stimuli each). Participants always completed the low cognitive load task first, followed by the high cognitive load task. No trial-by-trial performance feedback was provided during the main experimental blocks. Any feedback was restricted to the practice phase of the high cognitive load condition. Stimulus order was randomized. In high load trials, the name sequence onset, motion-tracking start time, deviant-tone distribution and number, and numeric response options were all randomized.
The two secondary tasks were selected to impose a significant cognitive load without inducing speech errors or articulatory distortions, as was verified during the pilot study. The motion-tracking task draws on visuospatial processing, rather than linguistic processing, with difficulty being parametrically controlled via dot motion coherence (e.g., Lively et al., 1993; Newsome et al., 1989; Révész et al., 2016), while sustained auditory attention and working memory are taxed by the tone-counting task (e.g., Brown, 2025; Harmon et al., 2019). Together, these tasks draw on distinct resource pools that do not directly compete with phonological, prosodic or articulatory processing, which is consistent with the theory of multiple resources (Wickens, 2008).
2.4.3 Data pre-processing
Data preparation and segmentation. Participant productions were automatically segmented using the Montreal Forced Aligner (McAuliffe et al., 2017) with a custom German dictionary. Trained research assistants then manually verified and corrected all segmentations. This manual verification process involved checking segmentation boundaries and correcting any mislabeled segments, including distinguishing between actual pauses and other phenomena, such as hesitations or stop closures. All pre-processing scripts are available in the Audio Analysis Pre-processing Scripts component of the OSF website for this article (https://osf.io/3ykhd/).
Extraction of prosodic boundary cues. Segment durations and pitch information were extracted using Praat scripts (Boersma & Weenink, 1992–2020) and logged in CSV files for further analysis:
Pitch range: The f0 range between the two syllables of the second name was calculated based on f0 at the Center of Periodic Mass (CoM), extracted using the ProPer toolbox (see Albert, 2023). First, the f0 value at the CoM was identified for each syllable separately. Second, the larger value was indexed as f0Max, and the smaller as f0Min. Pitch range was then calculated as the ratio of f0Max to f0Min at CoM, and transformed into semitones using the formula:
Pause duration: The duration of the silent interval after the second name was measured in milliseconds. For recordings without a pause, the duration was automatically coded as 0 ms. Hesitations and stop closures that were incorrectly labeled as pauses by the automatic aligner were manually recategorized during the verification process and not included in pause measurements.
Final lengthening: The duration of the final vowel segment of the second name was measured in milliseconds.
We analyzed pause duration and final lengthening in milliseconds, rather than as ratios, as originally preregistered. This decision was based on three considerations: (i) both measures were highly correlated with their ratio-based counterparts (r > .87), (ii) raw duration values can be directly analyzed without transformation by regression models that assume a lognormal response distribution, and (iii) raw values are more interpretable and can be more easily compared across participants and tasks. This change does not affect the core hypotheses or conclusions. Additionally, while we used the term f0 rise in the preregistration (following Huttenlauch et al., 2021), we use pitch range here to refer to the local f0 range between syllables, which better reflects the full range of contour shapes (rises, falls, mixed) used to signal prosodic boundaries (see Petrone et al., 2017).
2.4.4 Data exclusion
Data exclusion overall. From the total dataset, eight recordings (0.3%) were excluded, due to being incomplete, unintelligible, or of poor quality (e.g., background noise, excessive errors, or timing issues), or because reliable f0 measurements could not be obtained, due to issues like creaky voice or glottalization. These exclusion criteria were applied uniformly across all prosodic boundary cues and cognitive load task conditions, leaving 2872 recordings for the final analysis.
Data exclusion on pause usage. As expected, we found that across stimulus conditions, pauses were primarily employed in the bracket stimulus condition, when needed to mark the prosodic boundary. In the no-bracket stimulus condition, only 14% of recordings (200 out of 1388) contained pauses. Conversely, in the bracket stimulus condition, 92.7% of recordings contained pauses, and only 7.3% (101 recordings) did not. Given this disparity, we focused our pause duration analysis exclusively on bracket stimuli, where pause usage serves a meaningful prosodic function. This approach mirrors the findings and analysis of Huttenlauch et al. (2021), who observed a similar pattern.
2.5 Additional perception check for validation
To validate the perceptibility of the produced prosodic boundaries, we conducted a perception check using naïve listeners. Seven student labelers, unfamiliar with the study, listened to all recordings from the cognitive load production task in randomized order and categorized each as either bracket or no-bracket based on the perceived prosodic grouping. Labelers could replay recordings as needed and could also choose a “cannot determine” option for ambiguous cases. Response buttons were randomized but consistent for each labeler.
We modeled the perception data using a Bayesian multilevel logistic regression with a binomial outcome (correct/incorrect identification; “cannot determine” responses were excluded). The model included fixed effects for recording origin (high vs. low cognitive load), stimulus condition (bracket vs. no-bracket), and their interaction. We included by-subject and by-item random intercepts and slopes for all fixed effects. This approach allowed us to quantify how accurately listeners identified the presence vs. absence of an internal prosodic boundary and to determine whether identification was affected by cognitive load.
The perception check revealed high disambiguation accuracy across stimulus conditions, with naïve listeners correctly identifying the intended prosodic boundaries in over 90% of recordings. For recordings from the low cognitive load condition, accuracy was particularly high: 95.7% for bracket stimuli and 95.4% for no-bracket stimuli. While accuracy remained robust for recordings from the high cognitive load condition, it showed a slight decrease, to 90.3% for bracket stimuli and 93.0% for no-bracket stimuli. Ambiguity was rare across all stimulus conditions, with only 0.3–0.4% of recordings receiving “cannot determine” responses.
Bayesian multilevel logistic regression analysis revealed an effect of cognitive load on boundary identification accuracy (b = –0.456 log-odds, 95% credible interval (CI) [–0.774, –0.141]), indicating that prosodic boundaries were less accurately identified in recordings produced under high cognitive load than under low cognitive load. This corresponds to a 3.1 percentage point decrease in accuracy (low load: 97.8% vs. high load: 94.7%, estimated marginal means averaged across stimulus condition and random effects). We found no effect of stimulus condition (b = 0.0981 log-odds, 95% CI [–0.354, 0.546]), suggesting similar perceptibility for bracket and no-bracket productions. Also, no interaction between cognitive load and stimulus condition was observed (b = 0.012 log-odds, 95% CI [–0.503, 0.541]).
These findings confirm that participants successfully produced perceptually meaningful prosodic boundaries, with cognitive load creating detectable but relatively modest reductions in communicative effectiveness.
3. Statistical modeling
The statistical models were fit within a Bayesian framework, which allows combining prior information with data to generate posterior distributions for each parameter (Vasishth et al., 2018; Veríssimo, 2024). Bayesian mixed-effects distributional regression models were used via the brms package with RStan (Buerkner, 2018; Stan Development Team, 2020) to examine how the three prosodic boundary cues (pitch range, pause duration, final lengthening) related to auditory-perceptual acuity under varying cognitive loads. Unlike traditional regression approaches that focus solely on mean differences, distributional regression models estimate both mean prosodic boundary cue realization, modeled by a location parameter for the mean (μ), and trial-to-trial variability in prosodic boundary cue realization, modeled by a sigma parameter (σ). In the present study, μ captures production distinctiveness, whereas σ captures production variability, with lower σ indicating lower production variability. This approach aligns with recommendations to move beyond models that estimate only mean differences to capture how individuals differ not only in magnitude but also in consistency of cognitive processes (Ciaccio & Veríssimo, 2022).
For each prosodic boundary cue, we used a model tailored to the response variable’s distribution. Pitch range was modeled with a Gaussian distribution, appropriate for semitone-scale measurements. Pause duration (modeled only for bracket stimuli) required a hurdle-lognormal model: the hurdle component captured zero outcomes (no pauses, i.e., pause duration = 0), while the lognormal component modeled positive durations in bracket stimulus productions, where pauses serve a boundary-marking function (see 2.4.4). Final lengthening was modeled using a lognormal distribution. Both pause duration and final lengthening employed lognormal distributions, because their values are strictly positive and exhibit positively skewed distributions (Ciaccio & Veríssimo, 2022).
All dependent variables in the models are the acoustic feature measures of the prosodic boundary cues derived from the production task; auditory-perceptual acuity enters the models exclusively as a between-participants perception predictor derived from the independent JND perception tasks. The fixed effects in all models included stimulus condition (bracket vs. no-bracket) and cognitive load (high vs. low), both coded using sum contrasts (e.g., bracket/high load = +0.5; no-bracket/low load = –0.5). This contrast coding ensures that effects and interactions are interpreted at the mean of other predictors (i.e., averaged across their levels), rather than at a specific reference level. Additionally, we fitted models with nested contrasts to follow up on interactions between stimulus condition and cognitive load (Schad et al., 2020). All models included z-scored auditory-perceptual acuity scores (pitch acuity, pause acuity, final lengthening acuity).
We implemented a maximal random effects structure (Barr et al., 2013). Random effects included random intercepts for subjects and items, random slopes for stimulus condition and cognitive load for subjects and items, and random slopes for acuity scores for items only (as acuity is a between-participants measure). As preregistered, no random effects were included for the residual variability (sigma) component, because models with random effects on sigma take considerably longer to run, do not converge as easily, and we likely do not have sufficient data to estimate those parameters reliably (Bates et al., 2015). We implemented weakly-informative priors centered around zero on all parameters, following current recommendations (Gelman et al., 2008; J. Ghosh et al., 2018; McElreath, 2020; Vasishth et al., 2018). For intercept priors, we incorporated empirical data from Huttenlauch et al. (2021). The prior specifications were chosen to rule out only unreasonably extreme values, while still allowing large effects in either direction, as informed by the data. The appropriateness of these priors was confirmed through prior predictive checks. Prior specifications are provided in 1.1 (Prior distributions for all parameter estimates in the Bayesian distributional models) in the Supplementary Materials (page 2, https://doi.org/10.17605/OSF.IO/KQHMT).
The distributional models can be summarized schematically as follows, where × denotes the full factorial expansion, including all lower-order terms:
Pitch range model (Gaussian):
(E1)
Pause duration model (hurdle-lognormal, bracket only, no stimulus condition contrast):
(E2)
Final lengthening model (lognormal):
(E3)
The fixed effects in both μ and σ follow the same predictor structure, so effects on both parameters can be interpreted in parallel. A stimulus condition effect captures whether bracket and no-bracket productions differ in mean prosodic boundary cue realization (μ) or in trial-to-trial variability (σ, the spread of realizations across trials within bracket vs. within no-bracket). The interaction between stimulus condition and auditory-perceptual acuity shows whether this bracket/no-bracket difference varies with individual perceptual ability. Finally, the three-way interaction with cognitive load shows whether this modulation by auditory-perceptual acuity itself changes between low and high cognitive load.
Hypothesis testing was performed using Bayes factors, which quantify the strength of evidence for an effect by comparing an alternative model (including the effect) to a null model (excluding the effect). Since Bayes factors can be sensitive to prior specifications, we conducted a sensitivity analysis with five different prior configurations, ranging from narrower (moderately and strongly informative) to wider (moderately wide and wide) settings, compared to our default weakly-informative priors. The natural logarithm of the Bayes factor (lnBF10) was calculated using the Savage-Dickey method (Dickey & Lientz, 1970; Wagenmakers et al., 2010). In this scale, natural-logged Bayes factors greater than 1 provide evidence for the alternative hypothesis, and values below –1 provide evidence for the null hypothesis, with values between –1 and 1 considered inconclusive or weak (Kass & Raftery, 1995; Veríssimo, 2024). Natural-logged Bayes factors greater than 3 are interpreted as strong evidence against the null hypothesis (see Jeffreys, 1991; Kass & Raftery, 1995).
Model convergence was assessed using R-hat values, effective sample size, and visual inspection of trace plots. Additionally, posterior predictive checks were conducted, to evaluate model fit to the observed data distribution.
4. Results
We report the main perception-production analyses separately for each prosodic boundary cue: pitch range, pause duration, and final lengthening. We first report effects involving production distinctiveness (mean, μ; H1) and then effects involving production variability (sigma, σ; H2). For pitch range and final lengthening, production distinctiveness refers to the difference in mean cue realization between bracket and no-bracket productions. Production variability refers to the difference in trial-to-trial variability of cue realizations between bracket and no-bracket productions.
For pause duration, analyses focus on bracket productions only, because pauses were almost absent in no-bracket productions. Thus, pause distinctiveness (H1) refers to mean pause duration within bracket productions, and pause variability (H2) refers to the trial-to-trial variability of pause durations within bracket productions.
All σ estimates, their credible intervals, and Bayes factors are reported on the back-transformed SD scale of each dependent variable, while the raw log-scale estimates are provided in the Supplementary Materials (page 3 for pitch range, page 10 for pause duration, page 18 for final lengthening; https://doi.org/10.17605/OSF.IO/KQHMT).
Effects are reported when their natural-logged Bayes factors (lnBF10) exceed 1 in the base model with weakly-informative priors and show consistent patterns across the sensitivity analyses with different prior specifications. The evidence strength for such effects is characterized as moderate when lnBF10 > 1, and strong when lnBF10 > 3. Effects with lnBF10 values between 0 and 1 are reported as suggestive but inconclusive, reflecting limited evidence that is insufficient to clearly favor either the null or the alternative hypothesis. Such effects indicate directional tendencies in the data, but should not be interpreted as robust support for the corresponding hypothesis. We, nevertheless, report such effects when they become stronger under narrower priors or when follow-up analyses reveal simple effects with lnBF10 > 1.
4.1 Pitch range
Full fixed-effects tables, posterior distribution plots for both mean (μ) and variability (sigma, σ) parameters, and prior sensitivity analyses for the pitch range models are reported in 1.2 (Pitch range) in the Supplementary Materials (pages 3–8, https://doi.org/10.17605/OSF.IO/KQHMT).
4.1.1 Pitch range distinctiveness
We found suggestive evidence that pitch acuity (perception) modulated pitch range distinctiveness, that is, how strongly participants used pitch range to distinguish bracket productions from no-bracket productions, depending on their pitch acuity and averaged across cognitive load conditions (stimulus condition × pitch acuity interaction on the mean: b = 0.363 semitones, 95% CI [0.035, 0.688], lnBF10 = 0.59). The evidence for this effect strengthened to moderate levels under narrower prior specifications (lnBF10 up to 1.03). All participants used a higher pitch range in bracket productions than no-bracket productions, but the size of this difference varied with pitch acuity. As illustrated in Figure 2, participants at the upper end of the pitch acuity range (+1 SD) produced a bracket/no-bracket pitch range difference of 3.193 semitones (95% CI [2.710, 3.673], lnBF10 > 23), compared to 1.915 semitones (95% CI [1.057, 2.788], lnBF10 = 5.80) for participants at the lower end (–2.5 SD).
To understand where this interaction originates, we examined the effect of pitch acuity separately within each stimulus condition. In bracket productions, the regression line has a positive slope: pitch range increased with pitch acuity, meaning that participants with higher pitch acuity used a higher pitch range when marking a boundary than participants with lower pitch acuity, though the evidence for this relationship was only suggestive (b = 0.407 semitones, 95% CI [–0.002, 0.817], lnBF10 = 0.25). In no-bracket productions, by contrast, the regression line is nearly flat: pitch range was unrelated to pitch acuity (b = 0.044 semitones, 95% CI [–0.221, 0.313], lnBF10 = –2.1), meaning that all participants produced similarly lower pitch ranges when no boundary was to be marked, regardless of their pitch acuity. This asymmetry in slopes is visually apparent in Figure 2. However, given the limited evidence for the simple effect in bracket productions, the magnitude of this association is likely small and should be interpreted with caution.
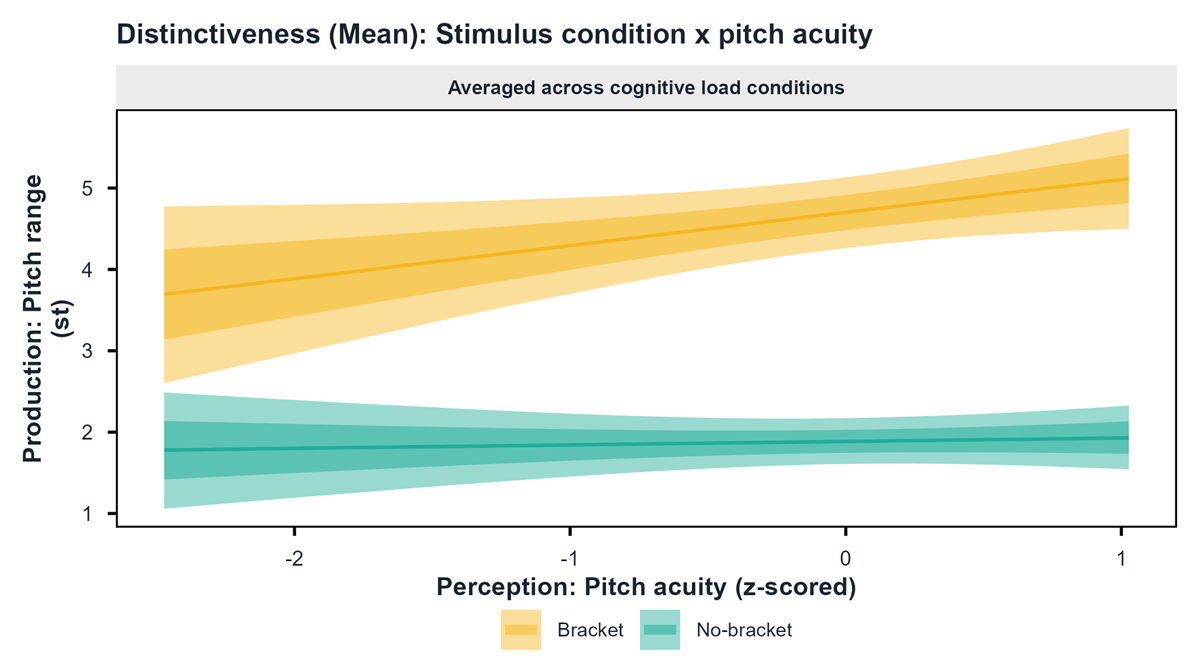
Figure 2: Predicted mean pitch range (in semitones) as a function of pitch acuity (z-scored; higher values indicate better auditory-perceptual discrimination), averaged across cognitive load conditions. The plot illustrates pitch range distinctiveness (mean), that is, how strongly participants used pitch range to distinguish bracket from no-bracket productions across the pitch acuity range. Regression lines represent posterior mean estimates, with shaded bands indicating 68% (darker) and 95% (lighter) credible intervals. Yellow lines correspond to bracket stimuli, and green lines correspond to no-bracket stimuli.
Finally, cognitive load did not modulate the relationship between pitch acuity and the pitch range difference between bracket and no-bracket productions (stimulus condition × cognitive load × pitch acuity interaction on the mean: b = 0.187 semitones, 95% CI [–0.097, 0.473], lnBF10 = –1.09, evidence for the null), consistent with the visual pattern in Figure 2.
4.1.2 Pitch range variability
We found moderate evidence that pitch acuity (perception) modulated pitch range variability (sigma, σ) differently across cognitive load conditions (stimulus condition × cognitive load × pitch acuity interaction on sigma: b = 0.130 SD semitones, 95% CI [0.021, 0.238], lnBF10 = 1.10). Here, variability refers to how much each individual participant’s own pitch range fluctuated from trial to trial. The three-way interaction indicates that how much more a given participant’s pitch range varied trial-to-trial in bracket productions compared to no-bracket productions, depended on both their pitch acuity and the cognitive load condition, as illustrated in Figure 3.
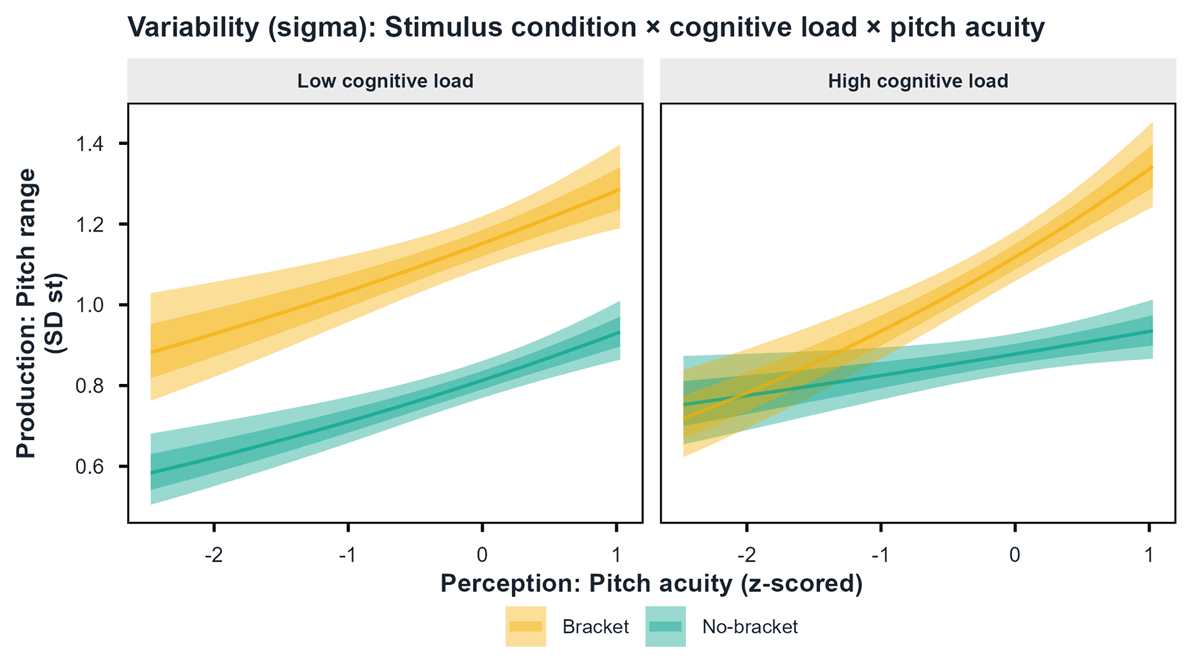
Figure 3: Predicted pitch range variability (sigma; SD of semitones, higher values indicate greater trial-to-trial variability) as a function of pitch acuity (z-scored; higher values indicate better auditory-perceptual acuity), stimulus condition (bracket vs. no-bracket), and cognitive load (low vs. high). The plot illustrates how the bracket/no-bracket difference in trial-to-trial pitch range variability scales with pitch acuity under each cognitive load condition. Regression lines represent posterior estimates of sigma, with shaded bands indicating 68% (darker) and 95% (lighter) credible intervals. Yellow lines correspond to bracket stimuli, and green lines correspond to no-bracket stimuli.
To understand where this interaction originates, we examined how pitch acuity related to the bracket/no-bracket difference in trial-to-trial variability separately under each cognitive load condition.
Under high cognitive load, pitch acuity strongly predicted differences between bracket and no-bracket productions in trial-to-trial pitch range variability (b = 0.149 SD semitones, 95% CI [0.071, 0.228], lnBF10 = 4.68). This is visible in the right panel of Figure 3 as a divergence between the two regression lines as pitch acuity increases: the bracket line has a positive slope, while the no-bracket line remains nearly flat. Participants with higher pitch acuity (+1 SD) showed considerably more trial-to-trial variability in pitch range during bracket productions than during no-bracket productions (b = 0.411 SD semitones, 95% CI [0.283, 0.543], lnBF10 > 23). This means, when marking a prosodic boundary under cognitive load, these participants drew on a wider range of pitch range realizations across repeated trials. Participants with lower pitch acuity (–2.5 SD), by contrast, showed no such difference in trial-to-trial variability between bracket and no-bracket productions (b = –0.034 SD semitones, 95% CI [–0.187, 0.120], lnBF10 = –2.01). In the right panel of Figure 3, this is visible at the lower end of the pitch acuity range, where the bracket and no-bracket regression lines converge and overlap, indicating that participants with lower pitch acuity showed similar trial-to-trial variability in both bracket and no-bracket productions, regardless of whether a boundary needed to be marked.
Under low cognitive load, pitch acuity did not predict a difference between bracket and no-bracket productions in trial-to-trial variability (b = 0.013 SD semitones, 95% CI [–0.068, 0.092], lnBF10 = –2.07, evidence for the null). As visible in the left panel of Figure 3, both regression lines have a positive slope and run in parallel. Participants with higher pitch acuity showed greater trial-to-trial variability in pitch range overall, in both bracket and no-bracket productions. The bracket/no-bracket difference in trial-to-trial variability was present across all pitch acuity levels and did not scale with pitch acuity, in contrast to the pattern observed under high cognitive load.
4.2 Pause duration
Complete model outputs for pause duration, including fixed effects for the lognormal and hurdle components, posterior distributions, and prior sensitivity analyses, are reported in 1.3 (Pause duration) in the Supplementary Materials (pages 9–16, https://doi.org/10.17605/OSF.IO/KQHMT).
4.2.1 Pause duration distinctiveness
We found no evidence that pause acuity (perception) modulated pause duration distinctiveness, that is, how strongly participants used pause duration to mark a prosodic boundary, depending on their pause acuity and averaged across cognitive load conditions. There was no main effect of pause acuity on pause duration (b = –0.108 log-ms, 95% CI [–0.269, 0.058], lnBF10 = –0.96), and no interaction between cognitive load and pause acuity (b = –0.012 log-ms, 95% CI [–0.141, 0.117], lnBF10 = –2.01). Participants produced pauses of similar duration, regardless of their pause acuity.
Cognitive load did, however, strongly modulate pause duration (b = –0.277 log-ms, 95% CI [–0.410, –0.143], lnBF10 = 5.65). As illustrated in Figure 4, participants with average pause acuity produced shorter pauses under high cognitive load than under low cognitive load. Given the absence of an interaction between cognitive load and pause acuity, this reduction was consistent across all pause acuity levels.
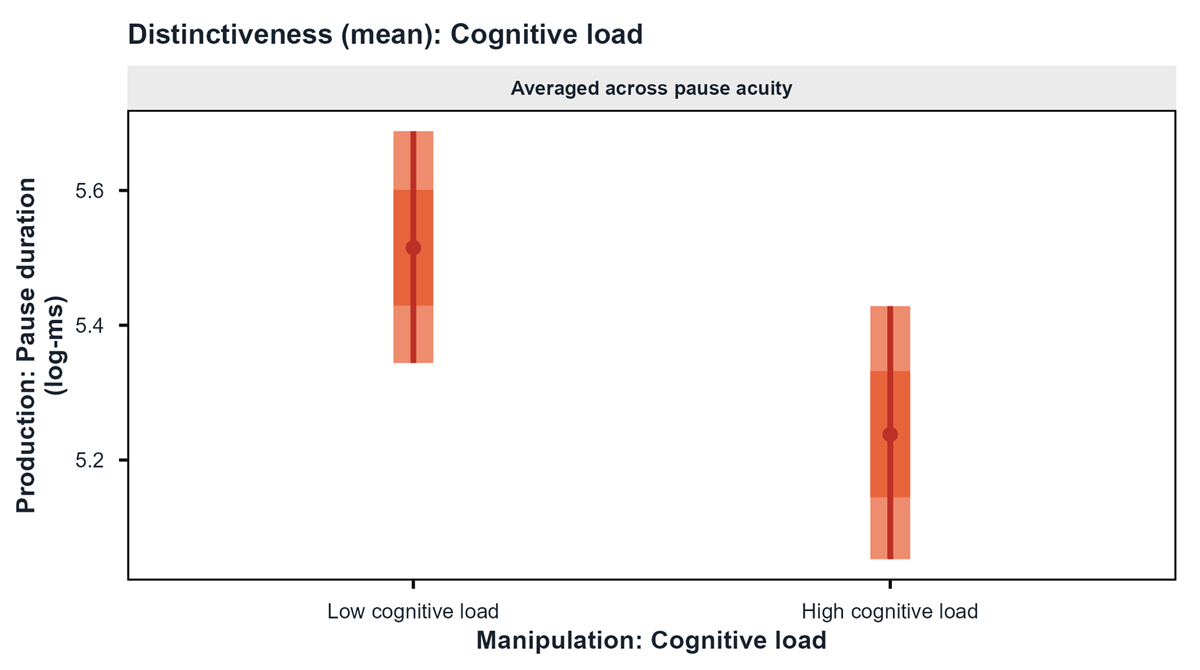
Figure 4: Predicted mean pause duration (log-ms) as a function of cognitive load (low vs. high), averaged across pause acuity. The plot illustrates how strongly participants used pause duration to mark a prosodic boundary within bracket productions across cognitive load conditions. Points and intervals represent posterior mean estimates, with shaded bands indicating 68% (darker) and 95% (lighter) credible intervals.
4.2.2 Pause duration variability
We found moderate evidence that pause acuity (perception) modulated pause duration variability (b = 0.027 SD log-ms, 95% CI [0.006, 0.049], lnBF10 = 1.49). Here, variability refers to how much each individual participant’s own pause duration fluctuated from trial to trial in bracket productions only. As illustrated in panel A of Figure 5, the regression line has a positive slope: participants with higher pause acuity showed greater trial-to-trial variability in pause duration than participants with lower pause acuity.
We also found strong evidence that cognitive load modulated pause duration variability (b = 0.093 SD log-ms, 95% CI [0.055, 0.131], lnBF10 > 23). As illustrated in panel B of Figure 5, participants with average pause acuity showed greater trial-to-trial variability in pause duration under high cognitive load than under low cognitive load. Given the absence of an interaction between cognitive load and pause acuity, this pattern held across all pause acuity levels.
These two effects were additive, rather than interactive. We found no evidence for an interaction between cognitive load and pause acuity on trial-to-trial variability (b = 0.003 SD log-ms, 95% CI [–0.039, 0.045], lnBF10 = –1.06). That is, higher pause acuity was associated with greater trial-to-trial variability in pause duration across both cognitive load conditions, and high cognitive load increased trial-to-trial variability across all pause acuity levels.
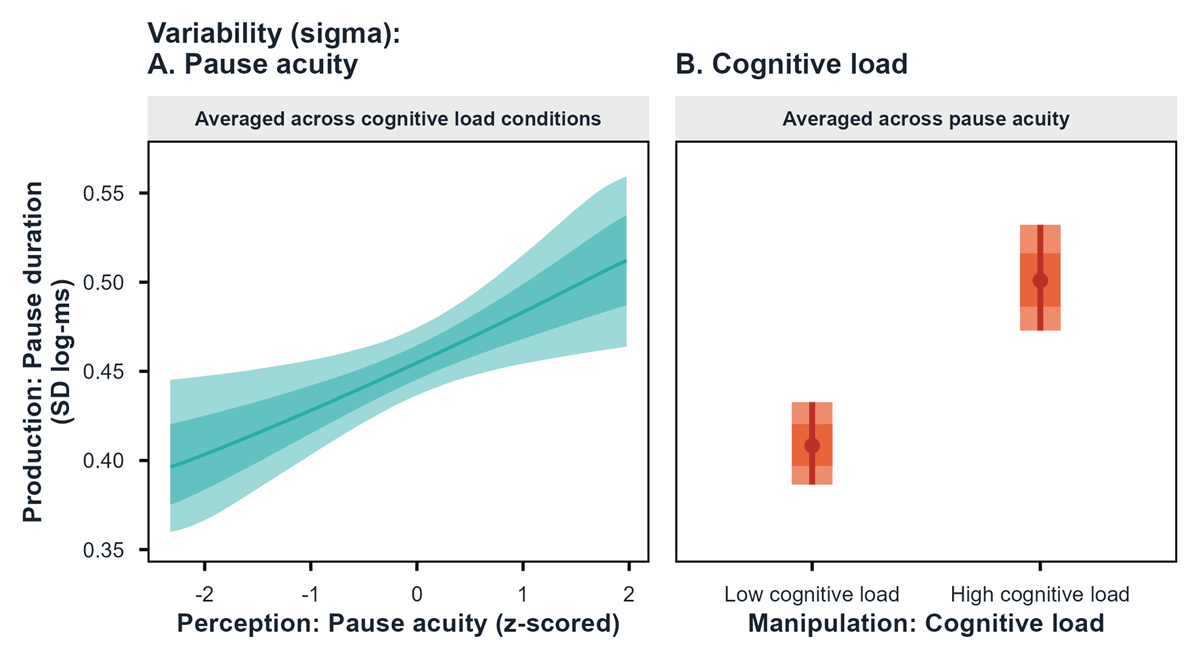
Figure 5: Predicted pause duration variability (sigma; SD of log-ms, higher values indicate greater trial-to-trial variability) as a function of (A) pause acuity (z-scored; higher values indicate better auditory-perceptual acuity), averaged across cognitive load conditions, and (B) cognitive load (low vs. high), averaged across pause acuity. The plots illustrate how trial-to-trial variability in pause duration relates to pause acuity and cognitive load within bracket productions. Regression lines in Panel A and posterior intervals in Panel B represent posterior estimates of sigma, with shaded bands indicating 68% (darker) and 95% (lighter) credible intervals.
4.2.3 Pause usage (hurdle parameter)
As an exploratory analysis, we examined whether pause acuity and cognitive load predicted whether participants used pauses at all to mark prosodic boundaries, independent of pause duration. This was assessed using the hurdle component of the pause model, which estimates the probability of producing no pause (i.e., a pause duration of zero). For ease of interpretation, the results are reported as pause usage probabilities (1 – hurdle probability). This analysis was not preregistered.
We found no evidence that the relationship between pause acuity and pause usage differed across cognitive load conditions (cognitive load × pause acuity interaction on hurdle: b = –0.357 log-odds, 95% CI [–0.884, 0.147], lnBF10 = –0.43, Bayes factors consistently favored, or tended toward, the null). Pause acuity did, however, predict pause usage. We found moderate evidence that higher pause acuity was associated with a higher probability of producing no pauses, and, thus, with reduced pause usage across all cognitive load conditions (b = 0.403 log-odds, 95% CI [0.146, 0.672], lnBF10 = 2.56). As illustrated in Panel A of Figure 6, the regression line has a negative slope: participants at the lower end of the pause acuity range (–2.3 SD) used pauses in 96.21% of bracket productions, compared to 87.18% for participants at the upper end (+2 SD).
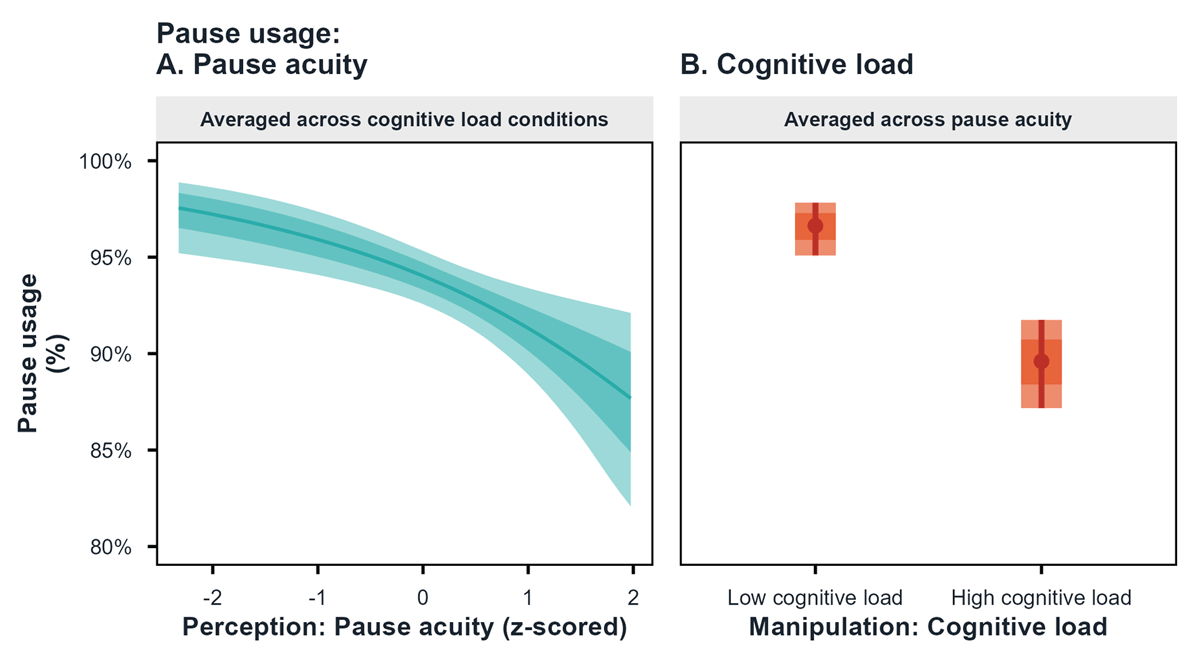
Figure 6: Predicted pause usage probability (expressed as the complement of the hurdle zero-pause probability) as a function of (A) pause acuity (z-scored; higher values indicate better auditory-perceptual acuity), averaged across cognitive load conditions, and (B) cognitive load (low vs. high), averaged across pause acuity. The plots illustrate how the probability of using a pause to mark a prosodic boundary within bracket productions relates to pause acuity and cognitive load. Points and intervals represent posterior predictions, with shaded bands indicating 68% (darker) and 95% (lighter) credible intervals.
We also found strong evidence that cognitive load predicted pause usage (b = 1.209 log-odds, 95% CI [0.738, 1.711], lnBF10 > 23): high cognitive load increased the probability of producing no pauses, corresponding to reduced pause usage under load. As illustrated in Panel B of Figure 6, participants with average pause acuity used pauses in 96.63% of bracket productions under low cognitive load, compared to 89.60% under high cognitive load. Given the absence of an interaction between cognitive load and pause acuity, this pattern held across all pause acuity levels.
4.3 Final lengthening
Detailed fixed-effects estimates, posterior distributions for mean and sigma parameters, and prior sensitivity analyses for the final lengthening models are reported in 1.4 (Final lengthening) in the Supplementary Materials (pages 17–22, https://doi.org/10.17605/OSF.IO/KQHMT).
4.3.1 Final lengthening distinctiveness
We found no evidence that final lengthening acuity modulated final lengthening production distinctiveness, that is, how strongly participants used final lengthening to distinguish bracket productions from no-bracket productions, depending on their final lengthening acuity and averaged across cognitive load conditions. There was no evidence for a three-way interaction between stimulus condition, cognitive load, and final lengthening acuity (b = 0.018 log-ms, 95% CI [–0.029, 0.066], lnBF10 = –2.74), and no evidence for a two-way interaction between stimulus condition and final lengthening acuity (b = 0.013 log-ms, 95% CI [–0.057, 0.084], lnBF10 = –2.57). Participants used final lengthening to distinguish bracket from no-bracket productions to a similar degree, regardless of their final lengthening acuity.
4.3.2 Final lengthening variability
We found no evidence that final lengthening acuity modulated final lengthening variability (sigma, σ). Here, variability refers to how much each individual participant’s own final lengthening fluctuated from trial to trial. There was no three-way interaction between stimulus condition, cognitive load, and final lengthening acuity (b = –0.010 SD log-ms, 95% CI [–0.030, 0.010], lnBF10 = –1.51), an inconclusive two-way interaction between stimulus condition and final lengthening acuity (b = –0.011 SD log-ms, 95% CI [–0.021, –0.001], lnBF10 = –0.29, all Bayes factors consistently favored, or tended toward, the null), and no main effect of final lengthening acuity (b = –0.002 SD log-ms, 95% CI [–0.007, 0.003], lnBF10 = –2.97). Participants with higher and lower final lengthening acuity showed similar trial-to-trial variability in final lengthening across both bracket and no-bracket productions.
Cognitive load did, however, strongly modulate final lengthening variability (b = 0.028 SD log-ms, 95% CI [0.019, 0.037], lnBF10 > 23). As illustrated in Figure 7, participants with average final lengthening acuity showed greater trial-to-trial variability in final lengthening under high cognitive load than under low cognitive load. Given the absence of an interaction between cognitive load and final lengthening acuity, this pattern held across all final lengthening acuity levels.
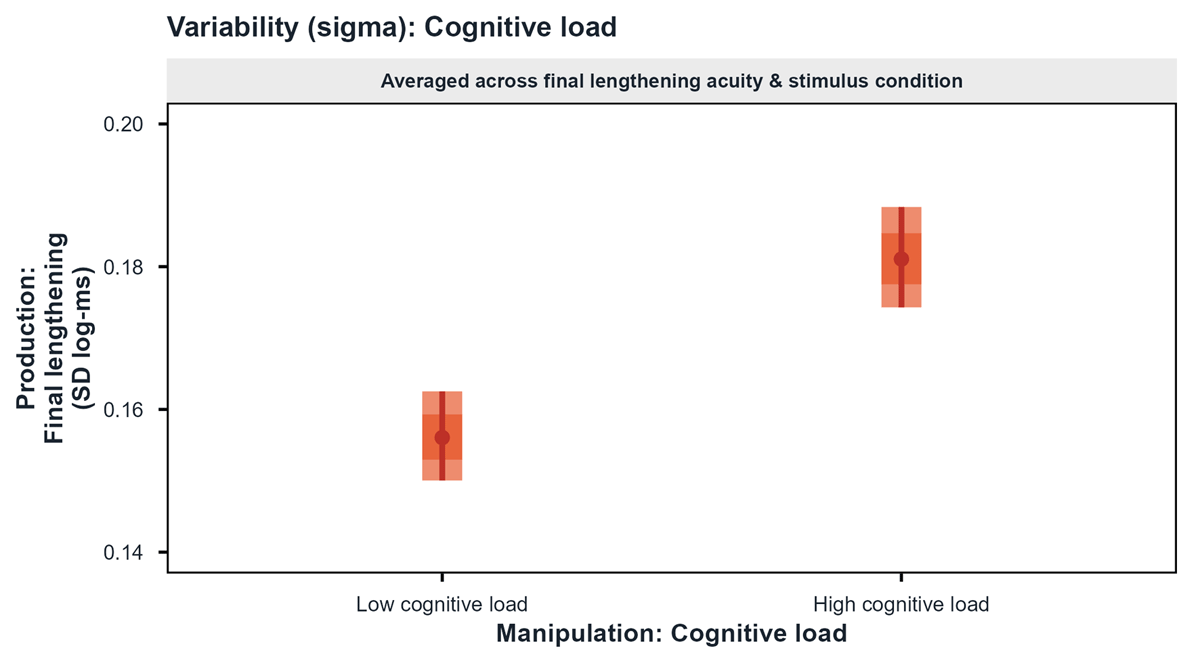
Figure 7: Predicted final lengthening variability (sigma; SD of log-ms, higher values indicate greater trial-to-trial variability) as a function of cognitive load (low vs. high), averaged across final lengthening acuity and stimulus condition. The plot illustrates how trial-to-trial variability in final lengthening relates to cognitive load across all final lengthening acuity levels. Points and intervals represent posterior estimates of sigma, with shaded bands indicating 68% (darker) and 95% (lighter) credible intervals.
4.4 Summary of PP-link findings
Table 1 provides an overview of our findings across all three prosodic boundary cues, summarizing the evidence for our two main hypotheses along with a short interpretation statement for each perception-production relationship examined.
Table 1: Summary of findings for prosodic boundary cue PP-links.
| Hypothesis | Main findings | Interpretation | |
| Pitch range | |||
| H1 (mean, μ): Distinctiveness | Higher pitch acuity → larger pitch range difference between bracket and no-bracket productions (μ), stronger under load. | Suggestive evidence for an acuity × stimulus condition interaction on mean pitch range (μ), averaged across cognitive load conditions. No evidence for an acuity × cognitive load × stimulus condition interaction. | Pitch acuity shows a directionally consistent with, but inconclusive association with, pitch range distinctiveness (mean pitch range differences between bracket and no-bracket productions); interpret cautiously. Partial support for H1 (μ). |
| H2 (sigma, σ): Variability | Higher pitch acuity → lower trial-to-trial variability (smaller σ, less variable), esp. under load. | Moderate evidence for an acuity × cognitive load × stimulus condition interaction on pitch range variability (σ). Under high cognitive load, bracket/no-bracket differences in trial-to-trial variability (σ) are larger for participants with higher pitch acuity than for participants with lower pitch acuity. | Higher pitch acuity is associated with greater (not lower) pitch range variability, expressed as stronger bracket/no-bracket differences in trial-to-trial variability under high cognitive load, which contradicts the prediction. No support for H2 (σ). |
| Pause duration (bracket only) | |||
| H1 (mean, μ): Distinctiveness | Higher pause acuity → longer pauses within bracket productions (μ), stronger under load. | Moderate evidence for a main effect of cognitive load, with higher load associated with shorter pauses. No evidence for an acuity × cognitive load interaction or for a main effect of pause acuity on mean pause duration (μ). | Mean pause duration is primarily affected by cognitive load; pause acuity does not predict pause duration distinctiveness (mean pause duration) within bracket productions. No support for H1 (μ). |
| H2 (sigma, σ): Variability | Higher pause acuity → lower trial-to-trial variability (smaller σ, less variable), esp. under load. | Moderate evidence for a main effect of pause acuity on pause duration variability (σ). Strong evidence for a main effect of cognitive load, with higher load increasing pause duration variability. No evidence for an acuity × cognitive load interaction. | Higher pause acuity is associated with greater (not lower) trial-to-trial variability in pause duration; cognitive load further increases variability; contradicts the prediction. No support for H2 (σ). |
| Pause usage (exploratory; hurdle) | Exploratory (not preregistered). | Moderate evidence for a main effect of pause acuity and strong evidence for a main effect of cognitive load on pause usage probability. No evidence for a cognitive load × pause acuity interaction. | Higher pause acuity is associated with reduced pause usage across both cognitive load conditions. High cognitive load further reduces pause usage independently of pause acuity. Warrants further investigation. Exploratory. |
| Final lengthening | |||
| H1 (mean, μ): Distinctiveness | Higher final lengthening acuity → larger final lengthening difference between bracket and no-bracket productions (μ), stronger under load. | No evidence for an acuity × cognitive load × stimulus condition interaction, an acuity × stimulus condition interaction, no main effect of final lengthening acuity on mean final lengthening (μ). | Final lengthening acuity does not predict final lengthening distinctiveness (mean final lengthening differences between bracket and no-bracket productions). No support for H1 (μ). |
| H2 (sigma, σ): Variability | Higher final lengthening acuity → lower trial-to-trial variability (smaller σ, less variable), esp. under load. | Strong evidence for a main effect of cognitive load, with higher load increasing variability. No evidence for an acuity × cognitive load × stimulus condition interaction, an acuity × stimulus condition interaction, or a main effect of final lengthening acuity on trial-to-trial variability in final lengthening (σ). | Final lengthening production variability is primarily modulated by cognitive load. Final lengthening acuity does not predict trial-to-trial variability in final lengthening. No support for H2 (σ). |
-
Note: Perception = auditory-perceptual acuity (z-scored, sign-reversed JND thresholds; higher values = better acuity). Production distinctiveness = model mean: for pitch range and final lengthening as the difference between bracket and no-bracket productions; for pause duration (bracket only) as mean pause duration within bracket productions. Production variability = model sigma: larger sigma indicates greater trial-to-trial variability.
5. Discussion
Our study examined whether individual differences in prosodic boundary cue perception predict how those same cues are produced, focusing on two separable aspects of production: distinctiveness and variability. Specifically, we tested whether auditory-perceptual acuity predicts (H1) the strength with which a prosodic boundary cue is used to distinguish bracket productions from no-bracket productions, and (H2) the trial-to-trial variability with which that prosodic boundary cue is produced, and whether these relationships are modulated by cognitive load.
Perception and production were assessed in separate tasks and linked at the level of individual differences, using distributional models that estimated both production distinctiveness (mean, μ, reflecting inter-individual differences) and trial-to-trial variability (sigma, σ, reflecting intra-individual differences) separately for each prosodic boundary cue. A summary of findings is provided in Table 1.
5.1 Pitch range
We found suggestive, rather than strong, evidence for the first hypothesis (H1) for pitch range: participants with higher pitch acuity produced larger pitch range differences between bracket and no-bracket productions (averaged across cognitive load conditions), but the evidence for this effect did not reach the threshold for strong support across prior specifications. This pattern is, nevertheless, directionally consistent with our predictions. The qualification “suggestive” reflects statistical strength, rather than a contradiction of the hypothesized effect.
In contrast, we found moderate evidence for a three-way interaction indicating that higher pitch acuity was associated with greater trial-to-trial variability in pitch range production, contradicting our second hypothesis (H2) that higher auditory-perceptual acuity would lead to less variable production. Participants with higher pitch acuity were considerably more variable in bracket productions than in no-bracket productions under both cognitive load conditions, and both the size of this difference and the variability level for each stimulus condition remained comparable across low and high cognitive load. Participants with lower pitch acuity also showed greater trial-to-trial variability in bracket productions than in no-bracket productions under low cognitive load, though at lower overall levels than participants with higher pitch acuity. Under high cognitive load, however, this difference disappeared: participants with lower pitch acuity showed the same amount of trial-to-trial variability in bracket and no-bracket productions, as their variability in bracket productions reduced to the level observed in no-bracket productions. Thus, while pitch acuity showed directional alignment with H1 at the level of production distinctiveness, it did not support the prediction of reduced trial-to-trial variability formulated in H2.
It could be argued that the finer resolution of the pitch range JND continuum, relative to the pause and final lengthening continua, might have increased the sensitivity of the pitch acuity measure, and thereby influenced the PP-link modeling. To address this concern, we conducted a post-hoc simulation analysis in which pitch range JND thresholds (and, thereafter, acuity scores) were recomputed from coarser continua. Refitting the pitch range production model with these simulated scores yielded virtually identical parameter estimates and Bayes factors, providing no evidence that continuum resolution biased our findings (see 1.5, Just-Noticeable-Difference (JND) task sensitivity analysis, in the Supplementary Materials for details; pages 23–24, https://doi.org/10.17605/OSF.IO/KQHMT).
5.2 Pause duration
We found no evidence that pause acuity predicts pause production distinctiveness (H1). Because pauses are almost exclusively used in bracket productions, distinctiveness for pauses was operationalized as mean pause duration within bracket productions rather than as a bracket/no-bracket contrast. Cognitive load had a strong main effect on mean pause duration: participants produced shorter pauses under high cognitive load than under low cognitive load, across all pause acuity levels.
In contrast, we found moderate evidence for a relationship between pause acuity and pause duration variability, again providing no support for H2. Participants with higher pause acuity showed greater trial-to-trial variability in pause duration, whereas participants with lower pause acuity showed less trial-to-trial variability in pause duration. This difference in trial-to-trial variability associated with pause acuity was present across both cognitive load conditions. Thus, as for pitch, higher pause acuity was associated with increased, rather than reduced, trial-to-trial variability, contradicting the prediction that higher acuity would lead to more stable production patterns. Exploratory analyses further indicated that pause acuity predicted pause usage. However, because this analysis was not preregistered and the pause acuity effect on usage probability was only moderate, we treat this pattern as tentative.
5.3 Final lengthening
Neither hypothesis was supported for final lengthening: final lengthening acuity did not predict final lengthening distinctiveness (H1) or trial-to-trial variability (H2) in final lengthening. In contrast, cognitive load had a strong main effect on final lengthening variability, increasing trial-to-trial variability across all final lengthening acuity levels. Thus, while final lengthening production was sensitive to increased processing demands, this sensitivity did not interact with final lengthening acuity. This absence of a PP-link for final lengthening stands in contrast to the patterns observed for pitch and pause, and is taken up in 5.4.
5.4 Cue-specific patterns
Our results reveal a clear cue-dependent PP-link pattern. Auditory-perceptual acuity related most robustly to pitch range, more weakly and differently to pause duration, and not reliably to final lengthening. Importantly, for the prosodic boundary cues showing evidence of a PP-link, this link emerged primarily in production variability (σ) rather than in production distinctiveness (μ).
This pattern suggests that individual differences in auditory-perceptual acuity primarily govern the trial-to-trial variability and, thus, flexibility with which speakers produce prosodic boundary cues across contexts, rather than the magnitude of their productions. This interpretation aligns with Xie et al.’s (2021) demonstration that prosodic production variability is functionally meaningful: their talker-specific ideal observer models outperformed generic models precisely because they captured the full distributional statistics of individual speakers’ cue production patterns, and listeners actively learned and exploited these talker-specific patterns to improve their categorization accuracy. From this perspective, speakers with better auditory-perceptual acuity may more flexibly adapt their coordination and weighting of prosodic cues to context. This is precisely the type of systematic distributional information that listeners are attuned to track. Thus, the variability effects we observed likely reflect communicative strategies, with production flexibility serving as a learnable signal that facilitates comprehension.
Pitch range showed the strongest and most selective PP-link, emerging for both production distinctiveness and trial-to-trial variability. Participants with higher pitch acuity produced larger pitch range differences between bracket and no-bracket productions across both cognitive load conditions, though this distinctiveness effect was only suggestive, and maintained a consistent bracket/no-bracket differentiation in trial-to-trial pitch range variability across both cognitive load conditions, showing comparably high variability in both bracket and no-bracket productions even under high cognitive load. Participants with lower pitch acuity, by contrast, produced smaller pitch range differences between bracket and no-bracket productions across both cognitive load conditions, and converged on more uniform pitch ranges under high cognitive load, showing reduced trial-to-trial variability in both bracket and no-bracket productions compared to low cognitive load. This divergence suggests that higher pitch acuity supports continued and more flexible modulation of pitch range when processing demands increase. Evidence from pitch perturbation studies points in the same direction: individuals with better pitch discrimination show stronger adaptive responses to sustained pitch shifts (Martin et al., 2018), and speakers actively regulate pitch to preserve communicative contrasts under challenging conditions (Patel et al., 2011). Together, these findings are consistent with pitch functioning as a flexible and central prosodic boundary cue in German (Holzgrefe-Lang et al., 2016; Huttenlauch et al., 2021; Petrone et al., 2017).
Pause duration showed a partially parallel profile: higher pause acuity was associated with greater trial-to-trial variability in pause duration production, but, unlike pitch, showed no corresponding modulation of mean pause duration. This dissociation suggests that, for pauses, higher pause acuity relates to how pauses are integrated into prosodic control, rather than to their average magnitude. Our exploratory analyses further indicated that participants with higher pause acuity relied less categorically on pause usage, showing greater flexibility in when they deployed pauses for marking a boundary. Importantly, reduced pause usage among participants with higher pause acuity did not reflect a general absence of pauses: all participants used pauses in the majority of bracket stimulus productions. Rather, pause omission occurred selectively and disproportionately among speakers with higher pause acuity, suggesting their reduced reliance on this categorical boundary cue and a greater ability to exploit alternative prosodic boundary cues when available. This pattern likely reflects pauses’ dual function in cognition and communication: marking boundaries for listeners and providing planning time for speakers (e.g., Ferreira & Karimi, 2015). Moreover, since pauses function as categorical perceptual cues once they exceed a perceptual threshold (e.g., Petrone et al., 2017), higher pause acuity may afford greater flexibility in pause usage, without requiring systematic scaling of pause duration in production.
Final lengthening showed no evidence for a PP-link, despite trial-to-trial variability being affected by cognitive load. This null result suggests that final lengthening may be governed primarily by automatic timing and sequencing processes that respond in a more uniform way to processing demands, rather than by perceptually guided adjustments. Consistent with this view, final lengthening exhibits non-monotonic scaling with boundary strength, and often decreases at strong boundaries where pauses take over (e.g., Kentner et al., 2023). It is also the least consistently used prosodic boundary cue across participants (e.g., Huttenlauch et al., 2021) and rarely functions as a reliable boundary signal in isolation (e.g., Holzgrefe-Lang et al., 2016), indicating that it plays a supportive rather than primary role in German prosodic boundary marking.
Overall, this cue-specific gradient aligns with perturbation evidence showing differential control mechanisms for spectral versus temporal cues. In particular, Patel et al. (2011) showed that when pitch (f0) is perturbed during sentence production, speakers compensate primarily by adjusting spectral properties, such as pitch and intensity, while durational properties remain comparatively stable. Likewise, timing-perturbation studies demonstrate that compensatory responses to temporal perturbations are organized at the level of prosodic structure, rather than at the level of individual segments, revealing that speakers maintain word-level timing relations, rather than, correcting segment durations in isolation (Oschkinat & Hoole, 2022). Moreover, this prosodic boundary cue gradient also matches broader observations. The use of pitch for boundary marking shows substantial cross-linguistic variability in both weighting and interpretation, reflecting its flexible role across prosodic systems, whereas temporal boundary cues, such as pauses and final lengthening, are more widely used across languages and tend to be more constrained in how flexibly they are deployed (e.g., Byrd et al., 2006; Ortega-Llebaria & Nagao, 2025; Wightman et al., 1992; Yang et al., 2014).
5.5 Segmental versus suprasegmental PP-links
Our hypotheses were informed by the segmental PP-link literature, which has consistently shown that participants with higher auditory-perceptual acuity tend to produce more precise and less variable segmental contrasts, even under challenging conditions (e.g., S. S. Ghosh et al., 2010; Perkell, Guenther, et al., 2004; Villacorta et al., 2007). We extended this logic to prosody, predicting that higher auditory-perceptual acuity for prosodic boundary cues would yield more distinct and more stable boundary marking, though, for temporal cues, this prediction was treated as an empirical question, rather than a direct extension of segmental evidence. Our findings only partially aligned with these predictions: distinctiveness effects were limited to pitch, while trial-to-trial variability effects emerged for both pitch and pause, but in the opposite direction: higher auditory-perceptual acuity was associated with greater, rather than lower, trial-to-trial variability. These patterns indicate that segmental perception-production predictions do not straightforwardly generalize to prosodic boundary marking.
A key reason may lie in how prosodic boundary cues are represented. The DIVA model formalizes segmental PP-links in terms of tightly coupled auditory-motor units, in which each speech sound is encoded as both an auditory target and a corresponding motor program (e.g., Guenther et al., 2013). This architecture supports direct mappings between auditory-perceptual discriminability and segmental production precision (e.g., Perkell, 2012). Prosodic boundary cues differ fundamentally in the nature of their representations: spectral cues, such as pitch, can be modeled as explicit auditory targets in a framework like DIVA, whereas durational and temporal cues, such as pause and final lengthening, are primarily represented as motor timing parameters, rather than as perceptual targets (e.g., Miller & Guenther, 2021; Zhang et al., 2015). The GODIVA extension addresses this by incorporating metrical and initiation maps that control the timing and sequencing of speech chunks (e.g., Bohland et al., 2010; Miller & Guenther, 2021), but these mechanisms are architecturally distinct from the auditory target representations available for spectral cues. This distinction has a plausible neurobiological basis: the right hemisphere’s longer temporal integration windows make it well-suited to tracking slow modulations, such as F0 contours and prosodic structure, whereas the faster left-hemisphere processing supports the sequencing and timing mechanisms underlying durational control (e.g., Arjmandi & Behroozmand, 2024; Floegel et al., 2020; Poeppel, 2003). An additional factor is that prosodic boundaries are realized through the graded modulation of multiple cues over extended temporal spans, and this redundancy allows speakers to achieve the same communicative goal through different cue combinations (e.g., Cho, 2016; Huttenlauch et al., 2021). PP-links at the level of prosodic boundary marking are, therefore, more likely to reflect shared control processes (i.e., how multiple cues are coordinated, weighted, and adapted) than the shared symbolic representations that characterize segmental auditory-motor target mappings.
Our findings partially align with these theoretical predictions, while also revealing aspects not yet captured by DIVA/GODIVA. The clearest acuity-related PP-link emerged for pitch, the prosodic boundary cue with explicit auditory target representation, consistent with the prediction that tonal cues benefit from acuity-tuned auditory error maps supporting continuous feedback correction. Pause showed partial linking only (pause acuity predicting trial-to-trial variability, but not mean duration), and final lengthening showed no linking at all, consistent with durational cues relying primarily on feedforward sequencing mechanisms less directly modulated by auditory-perceptual acuity (e.g., Civier et al., 2013; Tourville & Guenther, 2011). However, the directionality of the variability effect contradicts straightforward DIVA predictions. In segmental motor control, trial-to-trial variability would conventionally be interpreted as instability or motor noise resulting from poorly specified targets (Perkell, 2012). Our findings suggest a different interpretation for the prosodic domain: rather than reflecting imprecision, greater variability in speakers with higher auditory-perceptual acuity may reflect an expanded adaptive range, and, thus, the ability to flexibly modulate cue realization across varying contexts. One possibility is that this flexibility reflects the coordination of multiple cues: speakers with higher auditory-perceptual acuity for a given prosodic boundary cue may have access to a wider repertoire of cue combinations for signaling prosodic boundaries. This form of acuity-linked flexibility, relating to cue coordination rather than target precision, is – to the best of our knowledge – not yet captured in current neurocomputational models, which focus primarily on error minimization around fixed targets.
5.6 Limitations and future directions
Although we interpret the observed perception-production patterns primarily in terms of auditory-perceptual acuity interacting with cue-specific control demands, these relationships are likely shaped by additional cognitive and structural factors. For temporal prosody, in particular, perturbation work indicates that production responses are jointly influenced by auditory-perceptual acuity and rhythmic abilities, with their relative contributions varying as a function of prosodic structure and whether responses reflect online compensation or longer-term adaptation (e.g., Oschkinat et al., 2022). This suggests that temporal PP-links may depend on a broader set of moderators and task distinctions than perceptual resolution alone.
Beyond perceptual and motor constraints, individual differences in memory and attentional control may further shape how reliably participants produce distinctions between stimuli with and without a boundary, especially under cognitive load. Prosodic structure has been shown to influence how listeners allocate attention and encode material in memory, including benefits from pitch rises and boundary tones in serial recall tasks, pointing to systematic interactions between prosody, memory, and attention (e.g., Ferreira & Karimi, 2015; Grice et al., 2024; Lialiou et al., in press). From this perspective, PP-links may reflect learning, adaptation, and executive control processes in addition to auditory-perceptual resolution.
These considerations point to several concrete directions. First, the theoretical accounts advanced here could be tested more directly by incorporating independent measures of (i) working memory or serial recall, (ii) sustained attention or executive functioning, (iii) rhythmic or musical experience, and (iv) sensorimotor adaptation to auditory perturbations, and testing whether these variables explain variance in μ and/or σ beyond auditory-perceptual acuity. Second, PP-links for additional prosodic dimensions, such as intensity, have yet to be examined. Domain-initial strengthening is a particularly promising candidate, given that segments following a boundary show enhanced articulation (e.g., Cho et al., 2007). Third, presenting the secondary tasks in separate blocks would allow the independent contribution of each to the observed cognitive load effects to be formally tested. Finally, because prosodic boundary cue weighting differs across languages and prosodic systems, an important direction for future work is to test whether the cue-specific PP-link pattern observed here generalizes beyond German, particularly for pitch (e.g., Ortega-Llebaria & Nagao, 2025; Yang et al., 2014).
5.7 Conclusion
Cognitive load served as an effective stress test for prosodic production, revealing individual differences that were not apparent under low cognitive load. The data indicate a prosodic PP-link for pitch and pause, but not for final lengthening. Higher auditory-perceptual acuity was associated with greater production variability for pitch and pause, suggesting that for prosodic boundary marking, variability reflects adaptive flexibility in prosodic boundary cue production, rather than imprecision in motor control. Although this direction of the variability effects runs counter to our preregistered hypothesis (which predicted lower trial-to-trial variability with higher auditory-perceptual acuity), the pattern is consistent with variability reflecting adaptive flexibility in prosodic cue deployment, rather than motor imprecision. These cue-specific patterns align with theoretical distinctions between spectral and temporal cues in neurocomputational models, and suggest that prosodic PP-links emerge from the interaction of perceptual precision, control mechanisms, and contextual demands.
Abbreviations
BF – Bayes factor
CI – Credible interval
CoM – Center of periodic Mass
CSV – Comma-separated values
DIVA – Directions Into Velocities of Articulators (model)
f0 – Fundamental frequency
GODIVA – Gradient Order DIVA (model)
IQR – Interquartile range
JND – Just-Noticeable-Difference
lnBF10 – Natural logarithm of Bayes factor
ms – Milliseconds
OSF – Open Science Framework
PP-link – Perception-production link
ProPer – Prosodic analysis with Periodic energy (toolbox)
SD – Standard deviation
Data accessibility statement
All materials, data, and reproducible analysis code are available through the Open Science Framework: experimental code for production task (https://doi.org/10.17605/OSF.IO/N3Z2K), experimental code for perception task (https://doi.org/10.17605/OSF.IO/MQY2P), and analysis scripts with data (https://doi.org/10.17605/OSF.IO/KQHMT). Audio recordings are available upon request to the corresponding author.
Ethics and consent
The study was conducted in accordance with the Declaration of Helsinki and approved by the University of Potsdam Ethics Committee (approval code: 99/2020). Informed consent was obtained from all participants.
Acknowledgements
Funded by the Deutsche Forschungsgemeinschaft (DFG, German Research Foundation) – Project-ID 317633480 – SFB 1287. João Veríssimo has been funded by the Fundação para a Ciência e a Tecnologia (FCT, Foundation for Science and Technology), grant UID/00214/2025 to the Center of Linguistics of the University of Lisbon.
Competing interests
The authors have no competing interests to declare.
Author contributions
Andrea Hofmann: conceptualization, methodology, software, investigation, data curation, formal analysis, visualization, writing – original draft, writing – review & editing
Outi Tuomainen: conceptualization, funding acquisition, advice
Sandra Hanne: conceptualization, funding acquisition, advice
João Veríssimo: senior author, supervision, formal analysis, regular consultation, writing – review & editing
Isabell Wartenburger: senior author, supervision, conceptualization, funding acquisition, regular consultation, writing – review & editing
References
Albert, A. (2023). A model of sonority based on pitch intelligibility. Zenodo. http://doi.org/10.5281/zenodo.7837175
Arjmandi, M. K., & Behroozmand, R. (2024). On the interplay between speech perception and production: Insights from research and theories. Frontiers in Neuroscience, 18, 1347614. http://doi.org/10.3389/fnins.2024.1347614
Barr, D. J., Levy, R., Scheepers, C., & Tily, H. J. (2013). Random effects structure for confirmatory hypothesis testing: Keep it maximal. Journal of Memory and Language, 68(3). http://doi.org/10.1016/j.jml.2012.11.001
Bates, D., Kliegl, R., Vasishth, S., & Baayen, H. (2015). Parsimonious mixed models. http://arxiv.org/pdf/1506.04967
Boersma, P., & Weenink, D. (1992–2020). Praat: Doing phonetics by computer [computer program]. http://www.praat.org/
Bohland, J., Bullock, D., & Guenther, F. H. (2010). Neural representations and mechanisms for the performance of simple speech sequences. Journal of Cognitive Neuroscience, 22(7), 1504–1529. http://doi.org/10.1162/jocn.2009.21306
Brown, V. A. (2025). Measuring the dual-task costs of audiovisual speech processing across levels of background noise. Journal of Experimental Psychology. General, 154(12), 3428–3449. http://doi.org/10.1037/xge0001826
Brunner, J., Ghosh, S. S., Hoole, P., Matthies, M., Tiede, M., & Perkell, J. S. (2011). The influence of auditory acuity on acoustic variability and the use of motor equivalence during adaptation to a perturbation. Journal of Speech, Language, and Hearing Research, 54(3), 727–739. http://doi.org/10.1044/1092-4388(2010/09-0256)
Buerkner, P.-C. (2018). Advanced Bayesian multilevel modeling with the R package brms. The R Journal, 10(1), 395–411. http://doi.org/10.32614/RJ-2018-017
Byrd, D., Krivokapić, J., & Lee, S. (2006). How far, how long: On the temporal scope of prosodic boundary effects. The Journal of the Acoustical Society of America, 120(3), 1589–1599. http://doi.org/10.1121/1.2217135
Cho, T. (2016). Prosodic boundary strengthening in the phonetics–prosody interface. Language and Linguistics Compass, 10(3), 120–141. http://doi.org/10.1111/lnc3.12178
Cho, T., McQueen, J. M., & Cox, E. A. (2007). Prosodically driven phonetic detail in speech processing: The case of domain-initial strengthening in English. Journal of Phonetics, 35(2), 210–243. http://doi.org/10.1016/j.wocn.2006.03.003
Ciaccio, L. A., & Veríssimo, J. (2022). Investigating variability in morphological processing with Bayesian distributional models. Psychonomic Bulletin & Review, 29(6), 2264–2274. http://doi.org/10.3758/s13423-022-02109-w
Civier, O., Bullock, D., Max, L., & Guenther, F. H. (2013). Computational modeling of stuttering caused by impairments in a basal ganglia thalamo-cortical circuit involved in syllable selection and initiation. Brain and Language, 126(3), 263–278. http://doi.org/10.1016/j.bandl.2013.05.016
Cole, J., & Shattuck-Hufnagel, S. (2016). New methods for prosodic transcription: Capturing variability as a source of information. Laboratory Phonology, 7(1), 8, pp. 1–29. http://doi.org/10.5334/labphon.29
Dahl, K. L., Cádiz, M. D., Zuk, J., Guenther, F. H., & Stepp, C. E. (2024). Controlling pitch for prosody: Sensorimotor adaptation in linguistically meaningful contexts. Journal of Speech, Language, and Hearing Research, 67(2), 440–454. http://doi.org/10.1044/2023_JSLHR-23-00460
de Beer, C., Hofmann, A., Regenbrecht, F., Huttenlauch, C., Wartenburger, I., Obrig, H., & Hanne, S. (2022). Production and comprehension of prosodic boundary marking in persons with unilateral brain lesions. Journal of Speech, Language, and Hearing Research, 65(12), 4774–4796. http://doi.org/10.1044/2022_JSLHR-22-00258
Dickey, J. M., & Lientz, B. P. (1970). The weighted likelihood ratio, sharp hypotheses about chances, the order of a Markov chain. The Annals of Mathematical Statistics, 41(1), 214–226. http://doi.org/10.1214/aoms/1177697203
Elman, J. L. (1981). Effects of frequency-shifted feedback on the pitch of vocal productions. The Journal of the Acoustical Society of America, 70(1), 45–50. http://doi.org/10.1121/1.386580
Ferreira, F., & Karimi, H. (2015). Prosody, performance, and cognitive skill: Evidence from individual differences. Explicit and Implicit Prosody in Sentence Processing, 46, 119–132. http://doi.org/10.1007/978-3-319-12961-7_7
Flege, J. E. (1995). Second language speech learning theory, findings, and problems. In W. Strange (Ed.), Speech perception and linguistic experience (pp. 233–277). York Press.
Floegel, M., Fuchs, S., & Kell, C. A. (2020). Differential contributions of the two cerebral hemispheres to temporal and spectral speech feedback control. Nature Communications, 11(1), 2839. http://doi.org/10.1038/s41467-020-16743-2
Frazier, L., Carlson, K., & Clifton, C., JR. (2006). Prosodic phrasing is central to language comprehension. Trends in Cognitive Sciences, 10(6), 244–249. http://doi.org/10.1016/j.tics.2006.04.002
Gelman, A., Jakulin, A., Pittau, M. G., & Su, Y.-S. (2008). A weakly informative default prior distribution for logistic and other regression models. The Annals of Applied Statistics, 2(4). http://doi.org/10.1214/08-AOAS191
Ghaffarvand Mokari, P., Gafos, A. I., & Williams, D. (2020). Perceptuomotor compatibility effects in vowels: Beyond phonemic identity. Attention, Perception & Psychophysics, 82(5), 2751–2764. http://doi.org/10.3758/s13414-020-02014-1
Ghosh, J., Li, Y., & Mitra, R. (2018). On the use of Cauchy prior distributions for Bayesian logistic regression. Bayesian Analysis, 13(2). http://doi.org/10.1214/17-BA1051
Ghosh, S. S., Matthies, M. L., Maas, E., Hanson, A., Tiede, M., Ménard, L., Guenther, F. H., Lane, H., & Perkell, J. S. (2010). An investigation of the relation between sibilant production and somatosensory and auditory acuity. The Journal of the Acoustical Society of America, 128(5), 3079–3087. http://doi.org/10.1121/1.3493430
Gollrad, A., Sommerfeld, E., & Kügler, F. (2010). Prosodic cue weighting in disambiguation: Case ambiguity in German. Speech Prosody 2010, paper 165–0. http://doi.org/10.21437/SpeechProsody.2010-178
Grice, M., Savino, M., Schumacher, P. B., Röhr, C. T., & Ellison, T. M. (2024). Rises on pitch accents and edge tones affect serial recall performance at item and domain levels. Laboratory Phonology, 15(1). http://doi.org/10.16995/labphon.10473
Guenther, F. H. (1995). Speech sound acquisition, coarticulation, and rate effects in a neural network model of speech production. Psychological Review, 102(3), 594–621. http://doi.org/10.1037/0033-295x.102.3.594
Guenther, F. H. (2016). Neural control of speech. The MIT Press. http://doi.org/10.7551/mitpress/10471.001.0001
Guenther, F. H., Ghosh, S. S., Nieto-Castanon, A., & Tourville, J. A. (2013). A neural model of speech production. In J. Harrington & M. Tabain (Eds.), Speech production. Taylor and Francis.
Hansen, M., Huttenlauch, C., de Beer, C., Wartenburger, I., & Hanne, S. (2023). Individual differences in early disambiguation of prosodic grouping. Language and Speech, 66(3), 706–733. http://doi.org/10.1177/00238309221127374
Harmon, T. G., Jacks, A., & Haley, K. L. (2019). Speech fluency in acquired apraxia of speech during narrative discourse: Group comparisons and dual-task effects. American Journal of Speech-Language Pathology, 28(2S), 905–914. http://doi.org/10.1044/2018_AJSLP-MSC18-18-0107
Holzgrefe-Lang, J., Wellmann, C., Höhle, B., & Wartenburger, I. (2018). Infants’ processing of prosodic cues: Electrophysiological evidence for boundary perception beyond pause detection. Language and Speech, 61(1), 153–169. http://doi.org/10.1177/0023830917730590
Holzgrefe-Lang, J., Wellmann, C., Petrone, C., Räling, R., Truckenbrodt, H., Höhle, B., & Wartenburger, I. (2016). How pitch change and final lengthening cue boundary perception in German: Converging evidence from ERPs and prosodic judgements. Language, Cognition and Neuroscience, 31(7), 904–920. http://doi.org/10.1080/23273798.2016.1157195
Houde, J. F., & Jordan, M. I. (1998). Sensorimotor adaptation in speech production. Science, 279(5354), 1213–1216. http://doi.org/10.1126/science.279.5354.1213
Houde, J. F., & Jordan, M. I. (2002). Sensorimotor adaptation of speech. Journal of Speech, Language, and Hearing Research, 45(2), 295–310. http://doi.org/10.1044/1092-4388(2002/023)
Huttenlauch, C., de Beer, C., Hanne, S., & Wartenburger, I. (2021). Production of prosodic cues in coordinate name sequences addressing varying interlocutors. Laboratory Phonology: Journal of the Association for Laboratory Phonology, 12(1), 1. http://doi.org/10.5334/labphon.221
Jeffreys, H. (1991). Theory of probability (2nd ed.). Clarendon Press.
Kass, R. E., & Raftery, A. E. (1995). Bayes factors. Journal of the American Statistical Association, 90(430), 773–795. http://doi.org/10.1080/01621459.1995.10476572
Kentner, G., & Féry, C. (2013). A new approach to prosodic grouping. The Linguistic Review, 30(2). http://doi.org/10.1515/tlr-2013-0009
Kentner, G., Franz, I., Knoop, C. A., & Menninghaus, W. (2023). The final lengthening of pre-boundary syllables turns into final shortening as boundary strength levels increase. Journal of Phonetics, 97, 101225. http://doi.org/10.1016/j.wocn.2023.101225
Levitt, H. (1971). Transformed up-down methods in psychoacoustics. The Journal of the Acoustical Society of America, 49(2B), 467–477. http://doi.org/10.1121/1.1912375
Lialiou, M., Grice, M., & Schumacher, P. B. (in press). A test battery for measuring individual cognitive ability: A brief practical tutorial [author accepted manuscript]. Europe’s Journal of Psychology. http://doi.org/10.23668/psycharchives.21626
Lindblom, B. (1990). Explaining phonetic variation: A sketch of the H&H theory. In W. J. Hardcastle & A. Marchal (Eds.), Speech production and speech modelling (pp. 403–439). Springer. http://doi.org/10.1007/978-94-009-2037-8_16
Lively, S. E., Pisoni, D. B., van Summers, W., & Bernacki, R. H. (1993). Effects of cognitive workload on speech production: Acoustic analyses and perceptual consequences. The Journal of the Acoustical Society of America, 93(5), 2962–2973. http://doi.org/10.1121/1.405815
Männel, C., & Friederici, A. D. (2016). Neural correlates of prosodic boundary perception in German preschoolers: If pause is present, pitch can go. Brain Research, 1632, 27–33. http://doi.org/10.1016/j.brainres.2015.12.009
Martin, C. D., Niziolek, C. A., Duñabeitia, J. A., Perez, A., Hernandez, D., Carreiras, M., & Houde, J. F. (2018). Online adaptation to altered auditory feedback is predicted by auditory acuity and not by domain-general executive control resources. Frontiers in Human Neuroscience, 12, 91. http://doi.org/10.3389/fnhum.2018.00091
McAuliffe, M., Socolof, M., Mihuc, S., Wagner, M., & Sonderegger, M. (2017). Montreal Forced Aligner: Trainable text-speech alignment using Kaldi. Proceedings of Interspeech 2017, 498–502. http://doi.org/10.21437/Interspeech.2017-1386
McElreath, R. (2020). Statistical rethinking. Chapman and Hall/CRC. http://doi.org/10.1201/9780429029608
Meier, A. M., & Guenther, F. H. (2023). Neurocomputational modeling of speech motor development. Journal of Child Language, 50(6), 1318–1335. http://doi.org/10.1017/S0305000923000260
Miller, H. E., & Guenther, F. H. (2021). Modelling speech motor programming and apraxia of speech in the DIVA/GODIVA neurocomputational framework. Aphasiology, 35(4), 424–441. http://doi.org/10.1080/02687038.2020.1765307
Newman, R. S. (2003). Using links between speech perception and speech production to evaluate different acoustic metrics: A preliminary report. The Journal of the Acoustical Society of America, 113(5), 2850–2860. http://doi.org/10.1121/1.1567280
Newsome, W. T., Britten, K. H., & Movshon, J. A. (1989). Neuronal correlates of a perceptual decision. Nature, 341(6237), 52–54. http://doi.org/10.1038/341052a0
Ortega-Llebaria, M., & Nagao, J. (2025). When pitch falls short: Reinforcing prosodic boundaries to signal focus in Japanese. Languages, 10(9), 242. http://doi.org/10.3390/languages10090242
Oschkinat, M., & Hoole, P. (2022). Reactive feedback control and adaptation to perturbed speech timing in stressed and unstressed syllables. Journal of Phonetics, 91, 101133. http://doi.org/10.1016/j.wocn.2022.101133
Oschkinat, M., Hoole, P., Falk, S., & Dalla Bella, S. (2022). Temporal malleability to auditory feedback perturbation is modulated by rhythmic abilities and auditory acuity. Frontiers in Human Neuroscience, 16, 885074. http://doi.org/10.3389/fnhum.2022.885074
Patel, R., Niziolek, C. A., Reilly, K. J., & Guenther, F. H. (2011). Prosodic adaptations to pitch perturbation in running speech. Journal of Speech, Language, and Hearing Research, 54(4), 1051–1059. http://doi.org/10.1044/1092-4388(2010/10-0162)
Patel, R., & Schell, K. W. (2008). The influence of linguistic content on the Lombard effect. Journal of Speech, Language, and Hearing Research, 51(1), 209–220. http://doi.org/10.1044/1092-4388(2008/016)
Perkell, J. S. (2012). Movement goals and feedback and feedforward control mechanisms in speech production. Journal of Neurolinguistics, 25(5), 382–407. http://doi.org/10.1016/j.jneuroling.2010.02.011
Perkell, J. S., Guenther, F. H., Lane, H., Matthies, M. L., Stockmann, E., Tiede, M., & Zandipour, M. (2004). The distinctness of speakers’ productions of vowel contrasts is related to their discrimination of the contrasts. The Journal of the Acoustical Society of America, 116(4), 2338–2344. http://doi.org/10.1121/1.1787524
Perkell, J. S., Matthies, M. L., Tiede, M., Lane, H., Zandipour, M., Marrone, N., Stockmann, E., & Guenther, F. H. (2004). The distinctness of speakers’ /s/-/s/ contrast is related to their auditory discrimination and use of an articulatory saturation effect. Journal of Speech, Language, and Hearing Research, 47(6), 1259–1269. http://doi.org/10.1044/1092-4388(2004/095)
Petrone, C., Truckenbrodt, H., Wellmann, C., Holzgrefe-Lang, J., Wartenburger, I., & Höhle, B. (2017). Prosodic boundary cues in German: Evidence from the production and perception of bracketed lists. Journal of Phonetics, 61, 71–92. http://doi.org/10.1016/j.wocn.2017.01.002
Pijper, J. R. de, & Sanderman, A. A. (1994). On the perceptual strength of prosodic boundaries and its relation to suprasegmental cues. The Journal of the Acoustical Society of America, 96(4), 2037–2047. http://doi.org/10.1121/1.410145
Poeppel, D. (2003). The analysis of speech in different temporal integration windows: Cerebral lateralization as “asymmetric sampling in time.” Speech Communication, 41(1), 245–255. http://doi.org/10.1016/S0167-6393(02)00107-3
Révész, A., Michel, M., & Gilabert, R. (2016). Measuring cognitive task demands using dual task methodology, subjective self-ratings, and expert judgments: A validation study. Studies in Second Language Acquisition, 38(4), 703–737. http://doi.org/10.1017/S0272263115000339
Schad, D. J., Vasishth, S., Hohenstein, S., & Kliegl, R. (2020). How to capitalize on a priori contrasts in linear (mixed) models: A tutorial. Journal of Memory and Language, 110, 104038. http://doi.org/10.1016/j.jml.2019.104038
Schubö, F., Zerbian, S., Hanne, S., & Wartenburger, I. (2023). Prosodic boundary phenomena. Zenodo. http://doi.org/10.5281/zenodo.7777469
Smith, D. J., Stepp, C., Guenther, F. H., & Kearney, E. (2020). Contributions of auditory and somatosensory feedback to vocal motor control. Journal of Speech, Language, and Hearing Research, 63(7), 2039–2053. http://doi.org/10.1044/2020_JSLHR-19-00296
Stan Development Team. (2020). RStan: The R interface to Stan. https://mc-stan.org/
Tomassi, N. E., Weerathunge, H. R., Cushman, M. R., Bohland, J. W., & Stepp, C. E. (2022). Assessing ecologically valid methods of auditory feedback measurement in individuals with typical speech. Journal of Speech, Language, and Hearing Research, 65(1), 121–135. http://doi.org/10.1044/2021_JSLHR-21-00377
Tourville, J. A., & Guenther, F. H. (2011). The DIVA model: A neural theory of speech acquisition and production. Language and Cognitive Processes, 26(7), 952–981. http://doi.org/10.1080/01690960903498424
Tourville, J. A., Reilly, K. J., & Guenther, F. H. (2008). Neural mechanisms underlying auditory feedback control of speech. NeuroImage, 39(3), 1429–1443. http://doi.org/10.1016/j.neuroimage.2007.09.054
Vasishth, S., Nicenboim, B., Beckman, M. E., Li, F., & Kong, E. J. (2018). Bayesian data analysis in the phonetic sciences: A tutorial introduction. Journal of Phonetics, 71, 147–161. http://doi.org/10.1016/j.wocn.2018.07.008
Veríssimo, J. (2024). A gentle introduction to Bayesian statistics, with applications to bilingualism research. http://doi.org/10.31234/osf.io/7wfus_v1
Villacorta, V. M., Perkell, J. S., & Guenther, F. H. (2007). Sensorimotor adaptation to feedback perturbations of vowel acoustics and its relation to perception. The Journal of the Acoustical Society of America, 122(4), 2306–2319. http://doi.org/10.1121/1.2773966
Wagenmakers, E.-J., Lodewyckx, T., Kuriyal, H., & Grasman, R. (2010). Bayesian hypothesis testing for psychologists: A tutorial on the Savage-Dickey method. Cognitive Psychology, 60(3), 158–189. http://doi.org/10.1016/j.cogpsych.2009.12.001
Weerathunge, H. R., Alzamendi, G. A., Cler, G. J., Guenther, F. H., Stepp, C. E., & Zañartu, M. (2022). LaDIVA: A neurocomputational model providing laryngeal motor control for speech acquisition and production. PLoS Computational Biology, 18(6), e1010159. http://doi.org/10.1371/journal.pcbi.1010159
Whalen, D. H. (2020). The motor theory of speech perception. In M. Pouplier (Ed.), Oxford research encyclopedia of linguistics. Oxford University Press. http://doi.org/10.1093/acrefore/9780199384655.013.404
Wickens, C. D. (2008). Multiple resources and mental workload. Human Factors, 50(3), 449–455. http://doi.org/10.1518/001872008X288394
Wightman, C. W., Shattuck-Hufnagel, S., Ostendorf, M., & Price, P. J. (1992). Segmental durations in the vicinity of prosodic phrase boundaries. The Journal of the Acoustical Society of America, 91(3), 1707–1717. http://doi.org/10.1121/1.402450
Winkworth, A. L., & Davis, P. J. (1997). Speech breathing and the Lombard effect. Journal of Speech, Language, and Hearing Research, 40(1), 159–169. http://doi.org/10.1044/jslhr.4001.159
Xie, X., Buxó-Lugo, A., & Kurumada, C. (2021). Encoding and decoding of meaning through structured variability in intonational speech prosody. Cognition, 211, 104619. http://doi.org/10.1016/j.cognition.2021.104619
Yang, X., Shen, X., Li, W., & Yang, Y. (2014). How listeners weight acoustic cues to intonational phrase boundaries. PloS One, 9(7). http://doi.org/10.1371/journal.pone.0102166.g001
Zhang, S., Ji, Y., & He, L. (2015). Research on the mechanism for phonating stressed English syllables based on DIVA model. Neurocomputing, 152, 11–18. http://doi.org/10.1016/j.neucom.2014.11.032